Forsta Visualizations
Data in black & white. Stories in color.
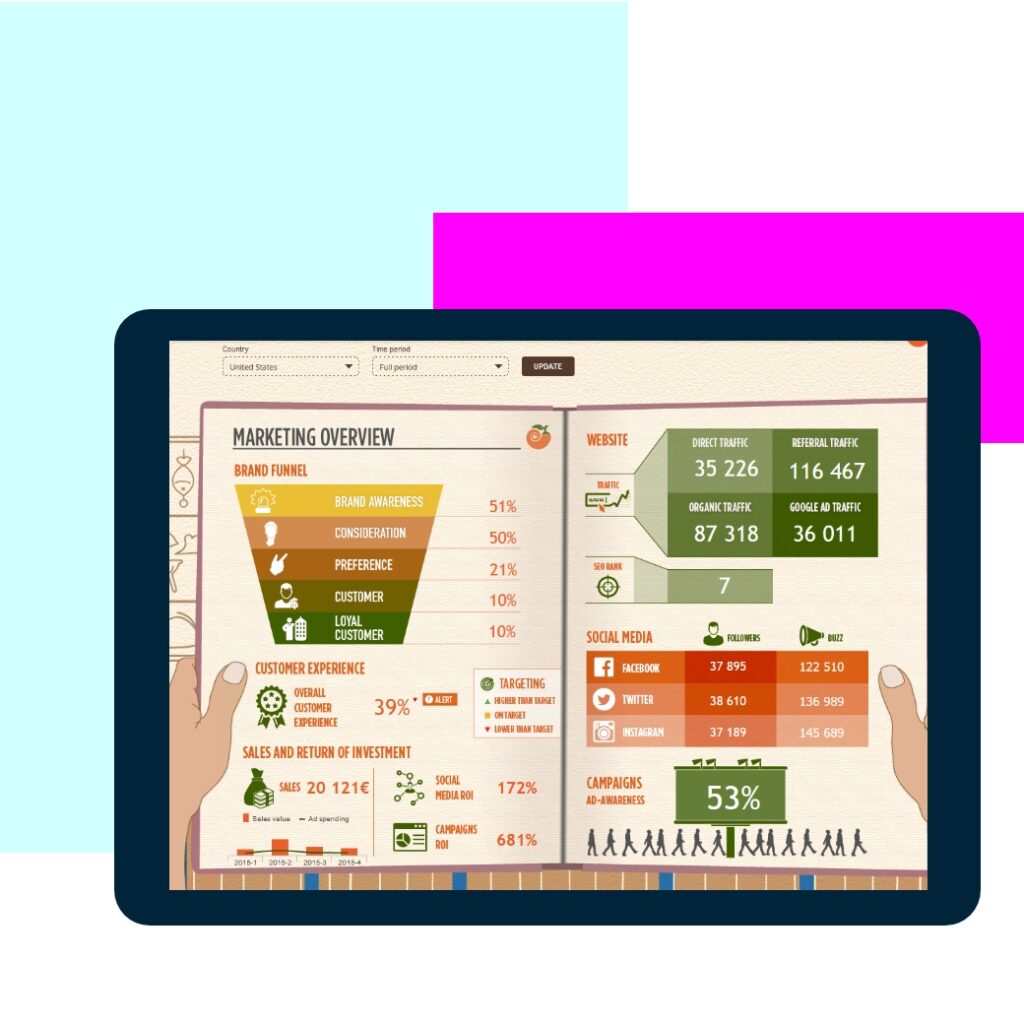
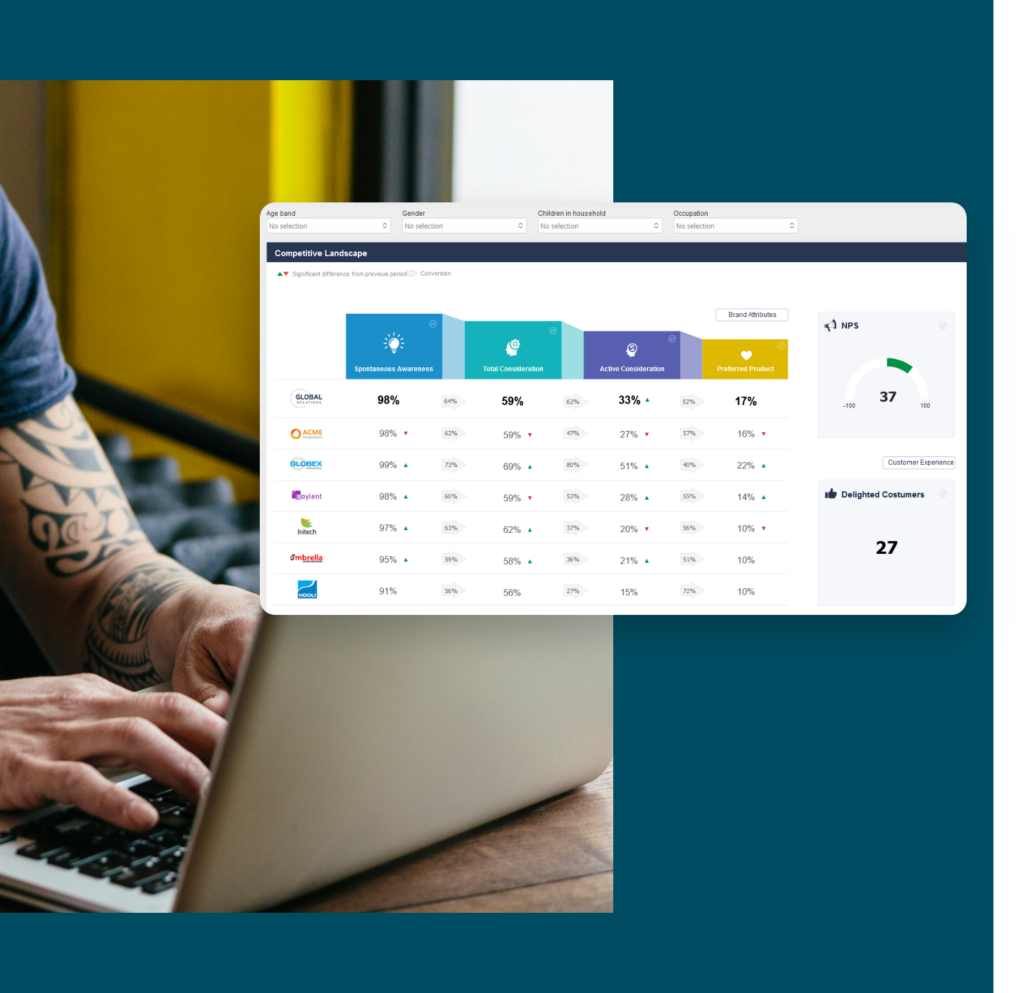
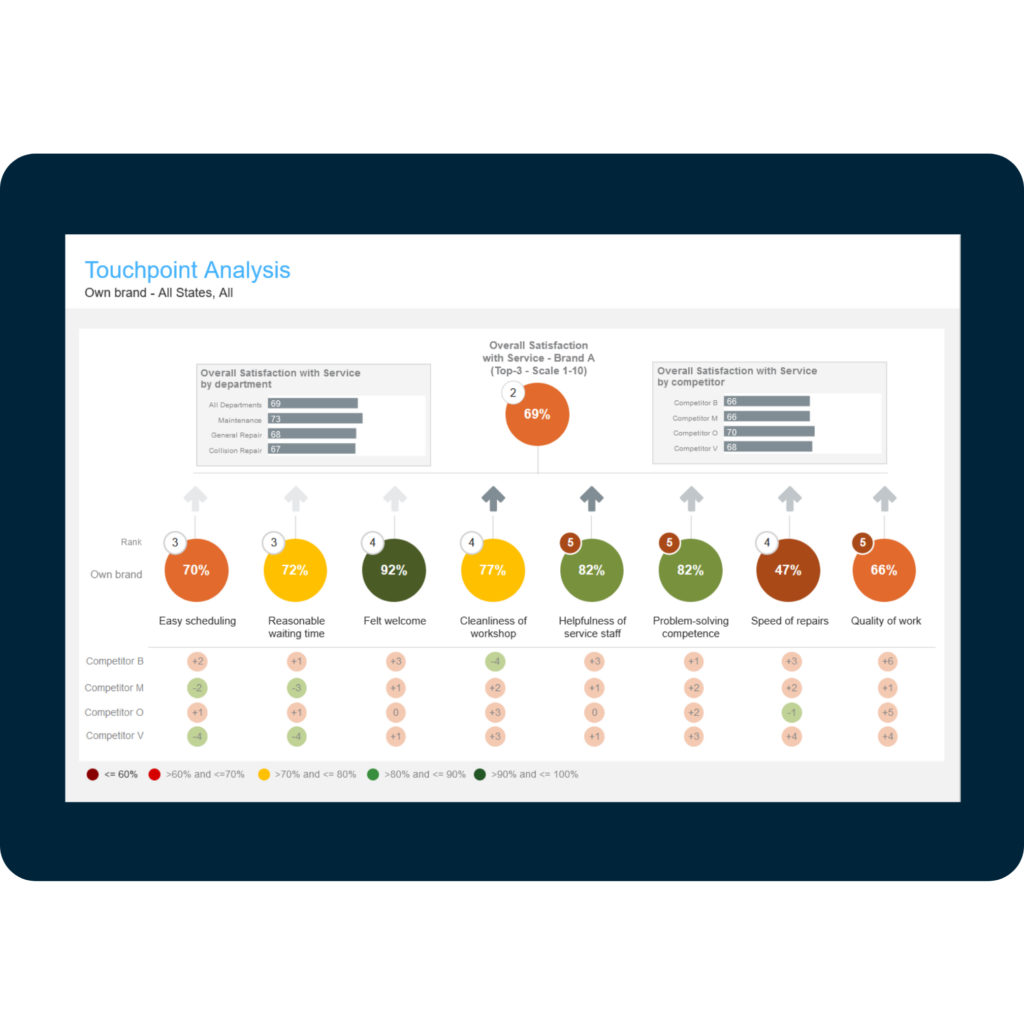
Make your data mean something. With Forsta, you can craft infographics that explain, inspire, and convince people to act. Show steps in a customer journey, spotlight the scale of an issue, or reveal trends trapped in your data screaming to get out.

How Forsta’s infographics bring
your data to life

Tell visual stories
All the tools you need to distill reems of data into vivid infographics. Create from scratch, or save and adapt. Use alone, or build into PowerPoints, PDFs and online dashboards.

Work fast
Drag-and-drop tools, design libraries, and no-snags export.

Get real-time data from a single source
Manual data entry? It gets pretty dull pretty fast. Forsta plugs your data right into your graphics, so you can cut errors and start to see the stories in your data from day one.

Give the right tools to the right users
A template library, built-in icons, and shapes make infographic building as sophisticated or as simple as each user needs.
AUTOMATION
Make magic, faster
We’ve cut the clicks in infographic building. You can set up rules so changes happen everywhere instantly, and watch as data flows in live. So no rooting around in data sets, manually updating charts, or mopping up errors.
INTUITIVE DESIGN TOOLS
The tools to transform your data
Forsta drag-and-drop dashboard and smart design tools make for slick infographic building. Instead of wasting time on tedious click-work, you can visualize ideas almost as fast as you can think them up. Use templates to whip up graphics in a flash, or get up close and personal with design – whatever suits each user.
INTEGRATION WITH SURVEY SOFTWARE
Let the data come to you
Wherever your data lives – data warehouse, survey system, CRM app or social platform – our APIs let it flow live and direct into your infographics. Set up alerts so you’ll know right away if something in your data’s looking fishy.
CASE STUDY
“Having the ability to not just show a chart but to tell a story in an infographic style really resonates well, especially with the Chief Marketing Officers. It’s easier for them to relate to. It means people can instantly see they are getting value out of their brand tracking programs.”
Scott Luck, Consumer Research Expert, Lieberman Research Worldwide