Data visualization: Visualizations
Data in black and white. Stories in color.
Don’t just build reports. Build momentum. Easily transform survey data into infographics and dashboards that drive action or detailed reports, including native PowerPoint. Research agents accelerate time to insight by 50%.
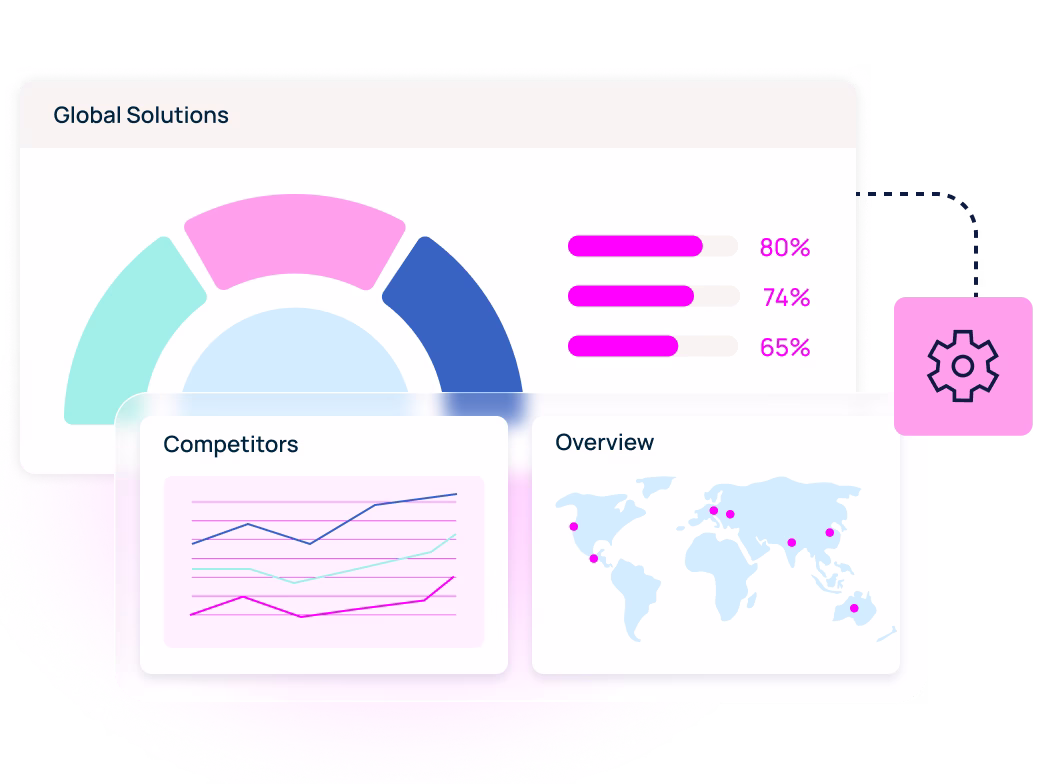
Transform data into vivid, stakeholder-ready stories
All-in-one reporting,
built for insights
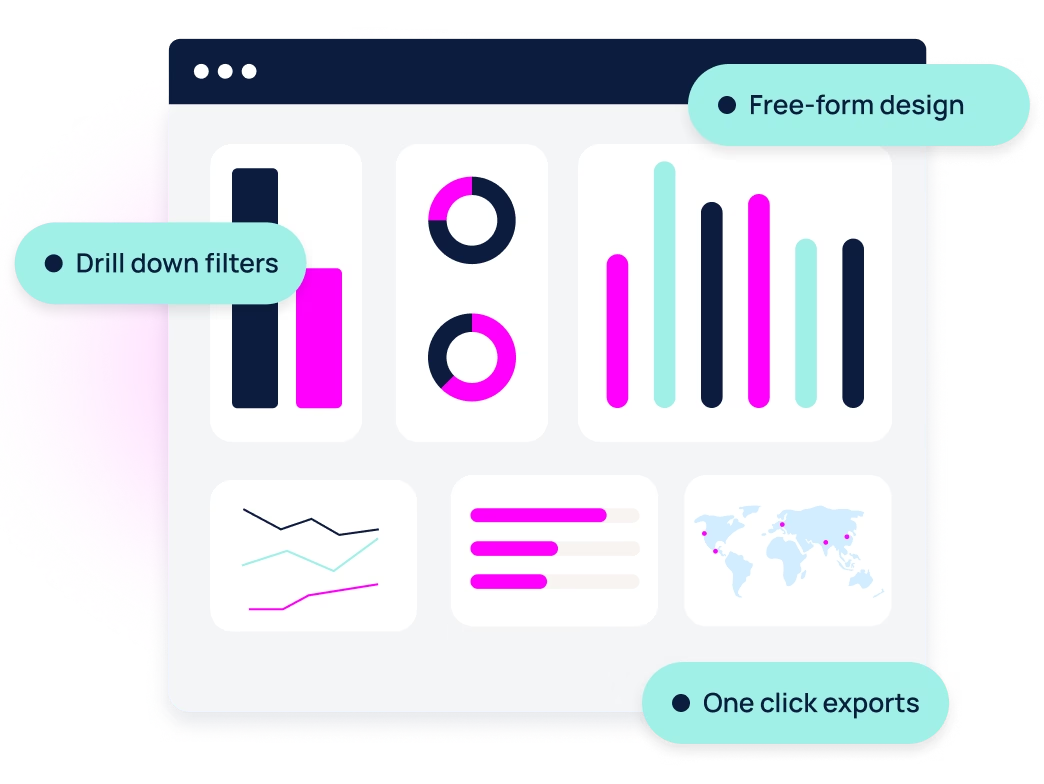
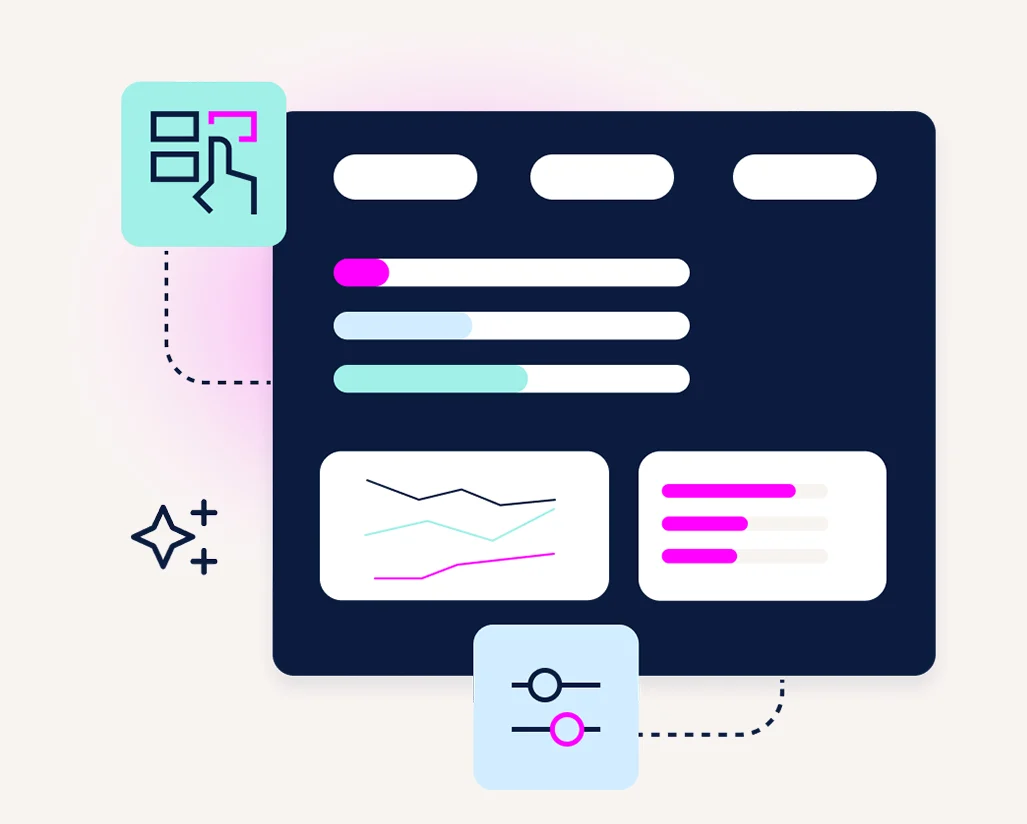
Drag-and-drop
free-form design
Move, resize, and style elements anywhere on the canvas. No code or scripting needed.
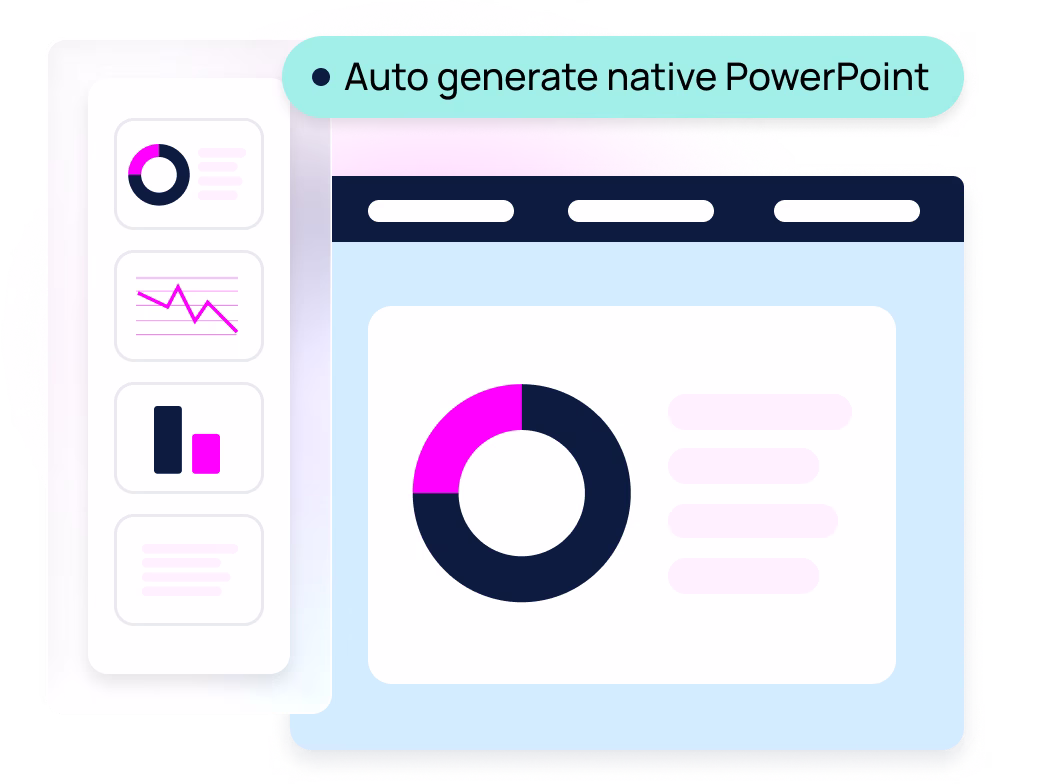
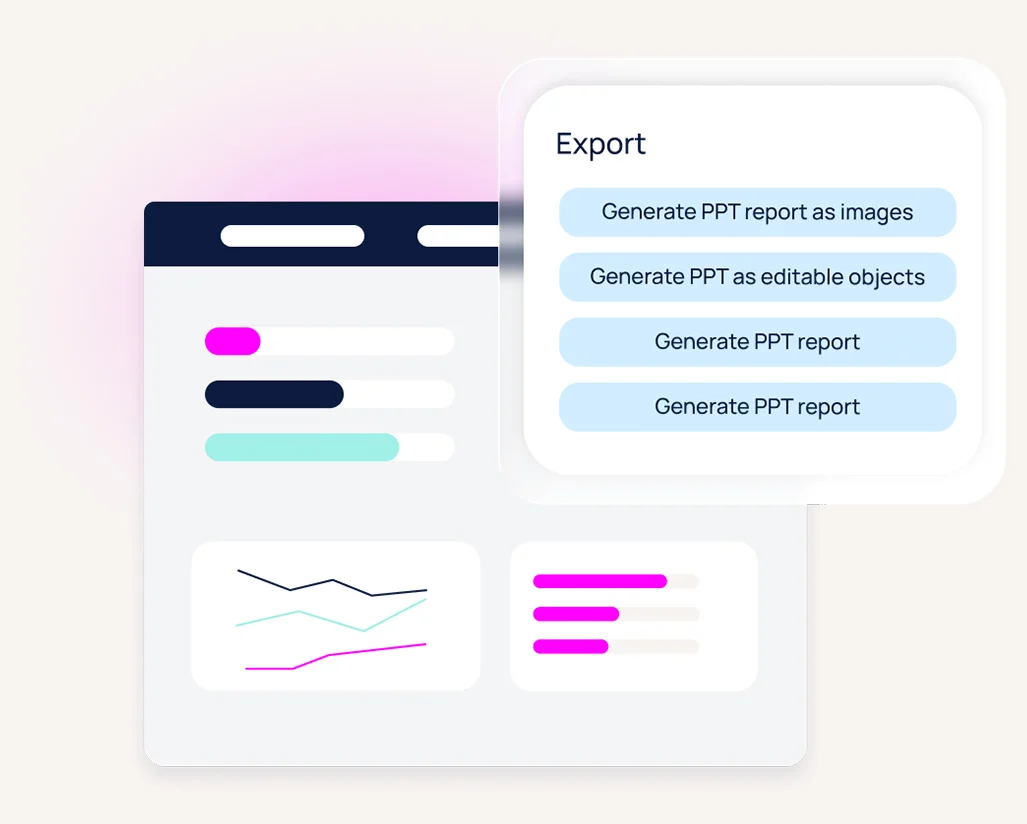
Automate reporting
Build native PowerPoint decks and online dashboards that auto-refresh with new data.
Native survey integration
Live connections to Decipher, Forsta Plus, and more let you report while fielding the research.
MR statistical engine
Run significance tests, apply weights, and analyze open-ends without leaving the platform.
Custom branding
Automate formatting across reports and decks with a brand’s look and feel.

“With Visualizations it instantly became four times faster to create the initial trending report and the client was empowered to handle almost all the
follow-up requests by stakeholders.”
Angel Roberts
VP, Trifecta Research
Get your questions answered
How does it work?
Connect your data, design your visuals, and automate updates. No coding needed.
How is it different?
Unlike static tools, visualizations deliver live, dynamic reports and scale customization.
How is it different from other BI tools?
It handles weighting, significance testing, and open-ends natively. You don’t need to write code to use it.
What support do I get?
You get full onboarding , training, access to templates, and a support team.
What results can I expect?
Faster turnaround, richer visuals, and fewer manual hours. Our users report time savings of up to 40% on reporting and far greater stakeholder engagement.
A comprehensive suite of market research tools
Advanced data collection
A trusted survey platform empowering top researchers to design, distribute, and analyze complex studies effortlessly.
Multi-mode research
Conduct complex, multi-mode research with one powerful platform uniting surveys, analytics, and feedback across every channel.
Data visualization
Empowers researchers to transform survey data into engaging dashboards and reports that drive insight and action.
Digital diaries
Capture authentic, in-the-moment feedback through digital diaries that reveal real behaviors, emotions, and motivations behind every experience.
Online focus groups
Effortlessly conduct professional, high-quality virtual focus groups with seamless tech, expert support, and insights—without the hassle.
Focus group streaming
Stream in-person focus groups securely from anywhere with high-quality video and effortless remote collaboration for teams.
Panel management
Build and maintain high-quality research panels. Manage millions of panelists, streamline sampling, and optimize every stage of research.
Start seeing human experience from every angle