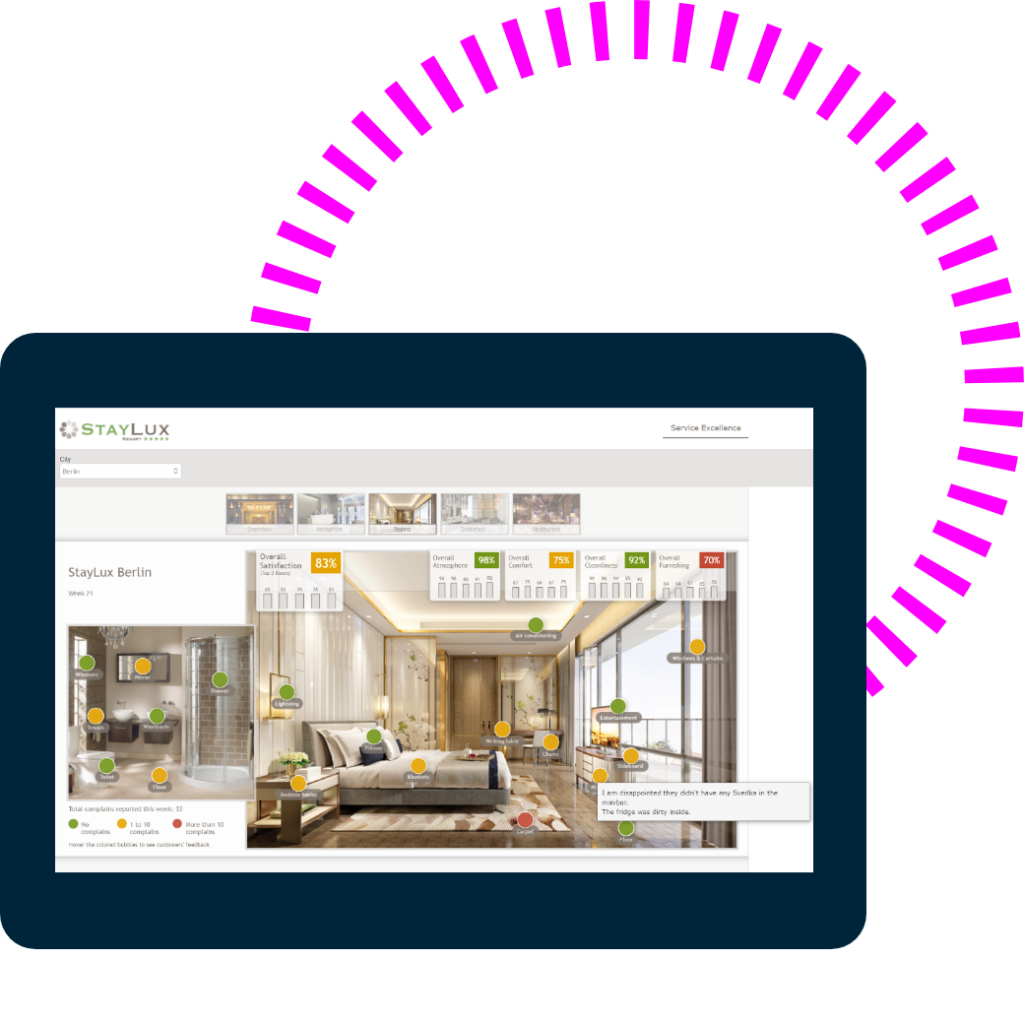
INTERACTIVE DASHBOARDS
See it all in an instant
Get the full picture on your data with online infographic dashboards. Create live, living visuals you can adjust and explore.

How Forsta brings your
data to life
Template library
Objects, slides, icons and shapes are on hand to help you build vivid visual dashboards.
Drag-and-drop build
No programming needed. Drag and drop to create dashboards intuitively.
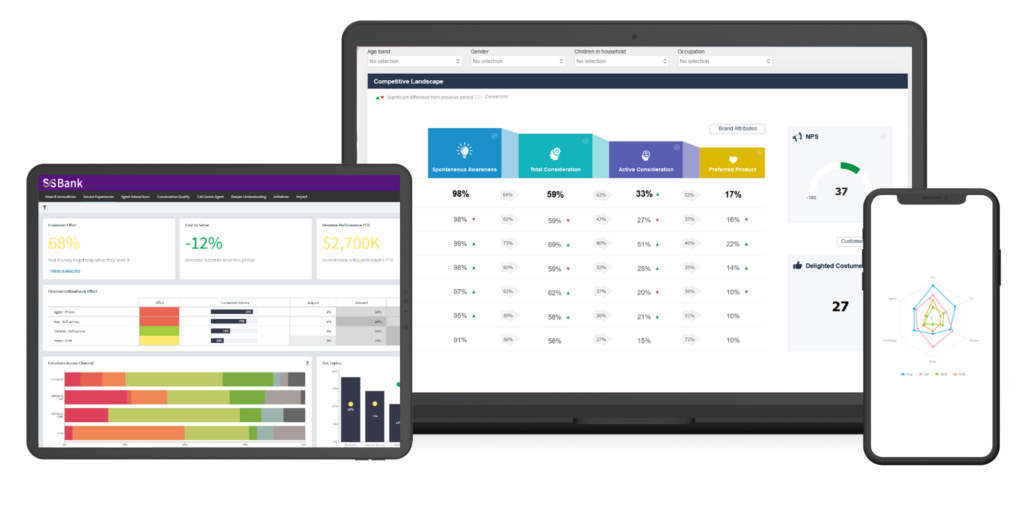
Flexible sharing
Deliver dashboards to anyone, on any device, and let them delve into the data with dynamic filters. You control what info different people see and what they can do with it.
Live data
Dashboards update themselves with each fresh wave of data, so you always know what’s happening as it’s happening.
INFOGRAPHICS
Stories you can see
Our platform has all the tools you need to turn lists of names and numbers into living breathing dashboards. A template library and drag-and-drop tools let you reinvent reporting so it’s visual, interactive, and accessible from anywhere.

LIVE REPORTING
On the pulse
Data is in constant shift, and your dashboard is the way to watch it move in real time. With graphics that refresh themselves live, and alerts when something looks off, your team can react as fast as your data changes.
The tools that make
Forsta sing

Custom views
You can tailor different dashboards to different people. Show them what they need to see when they need to see it, with none of the noise.

Device detection
Our platform knows what device your users are on. So dashboards always look right at home.

Dynamic filtering
Ask your data questions and get instant visual answers. Dynamic filters mean a dashboard’s never just a dashboard: it can give you a whole host of different info depending on how you slice it.
CASE STUDY
“We researched many dashboard tools, but Forsta was the best. The fact that the software was developed for and by researchers makes a difference. No other tool offers the visualization AND provides the hands-on table tool required by our clients. With Forsta, we get the best of both worlds.”
Randall Wahl, President, M/A/R/C Research