
Reporting

Get the facts, fast.
Turn raw data into insight-packed reports in just a fraction of the time that it takes you now. Forsta makes reporting so slick and simple you can produce reports how you want them, up-to-the minute, error free and put them into the hands of the people who need them. Fast.
Change up reports fast
If you need to deliver different versions of the same report, or send some key info on-the-fly, you can quickly adapt reports and update information across an entire report with just one click.
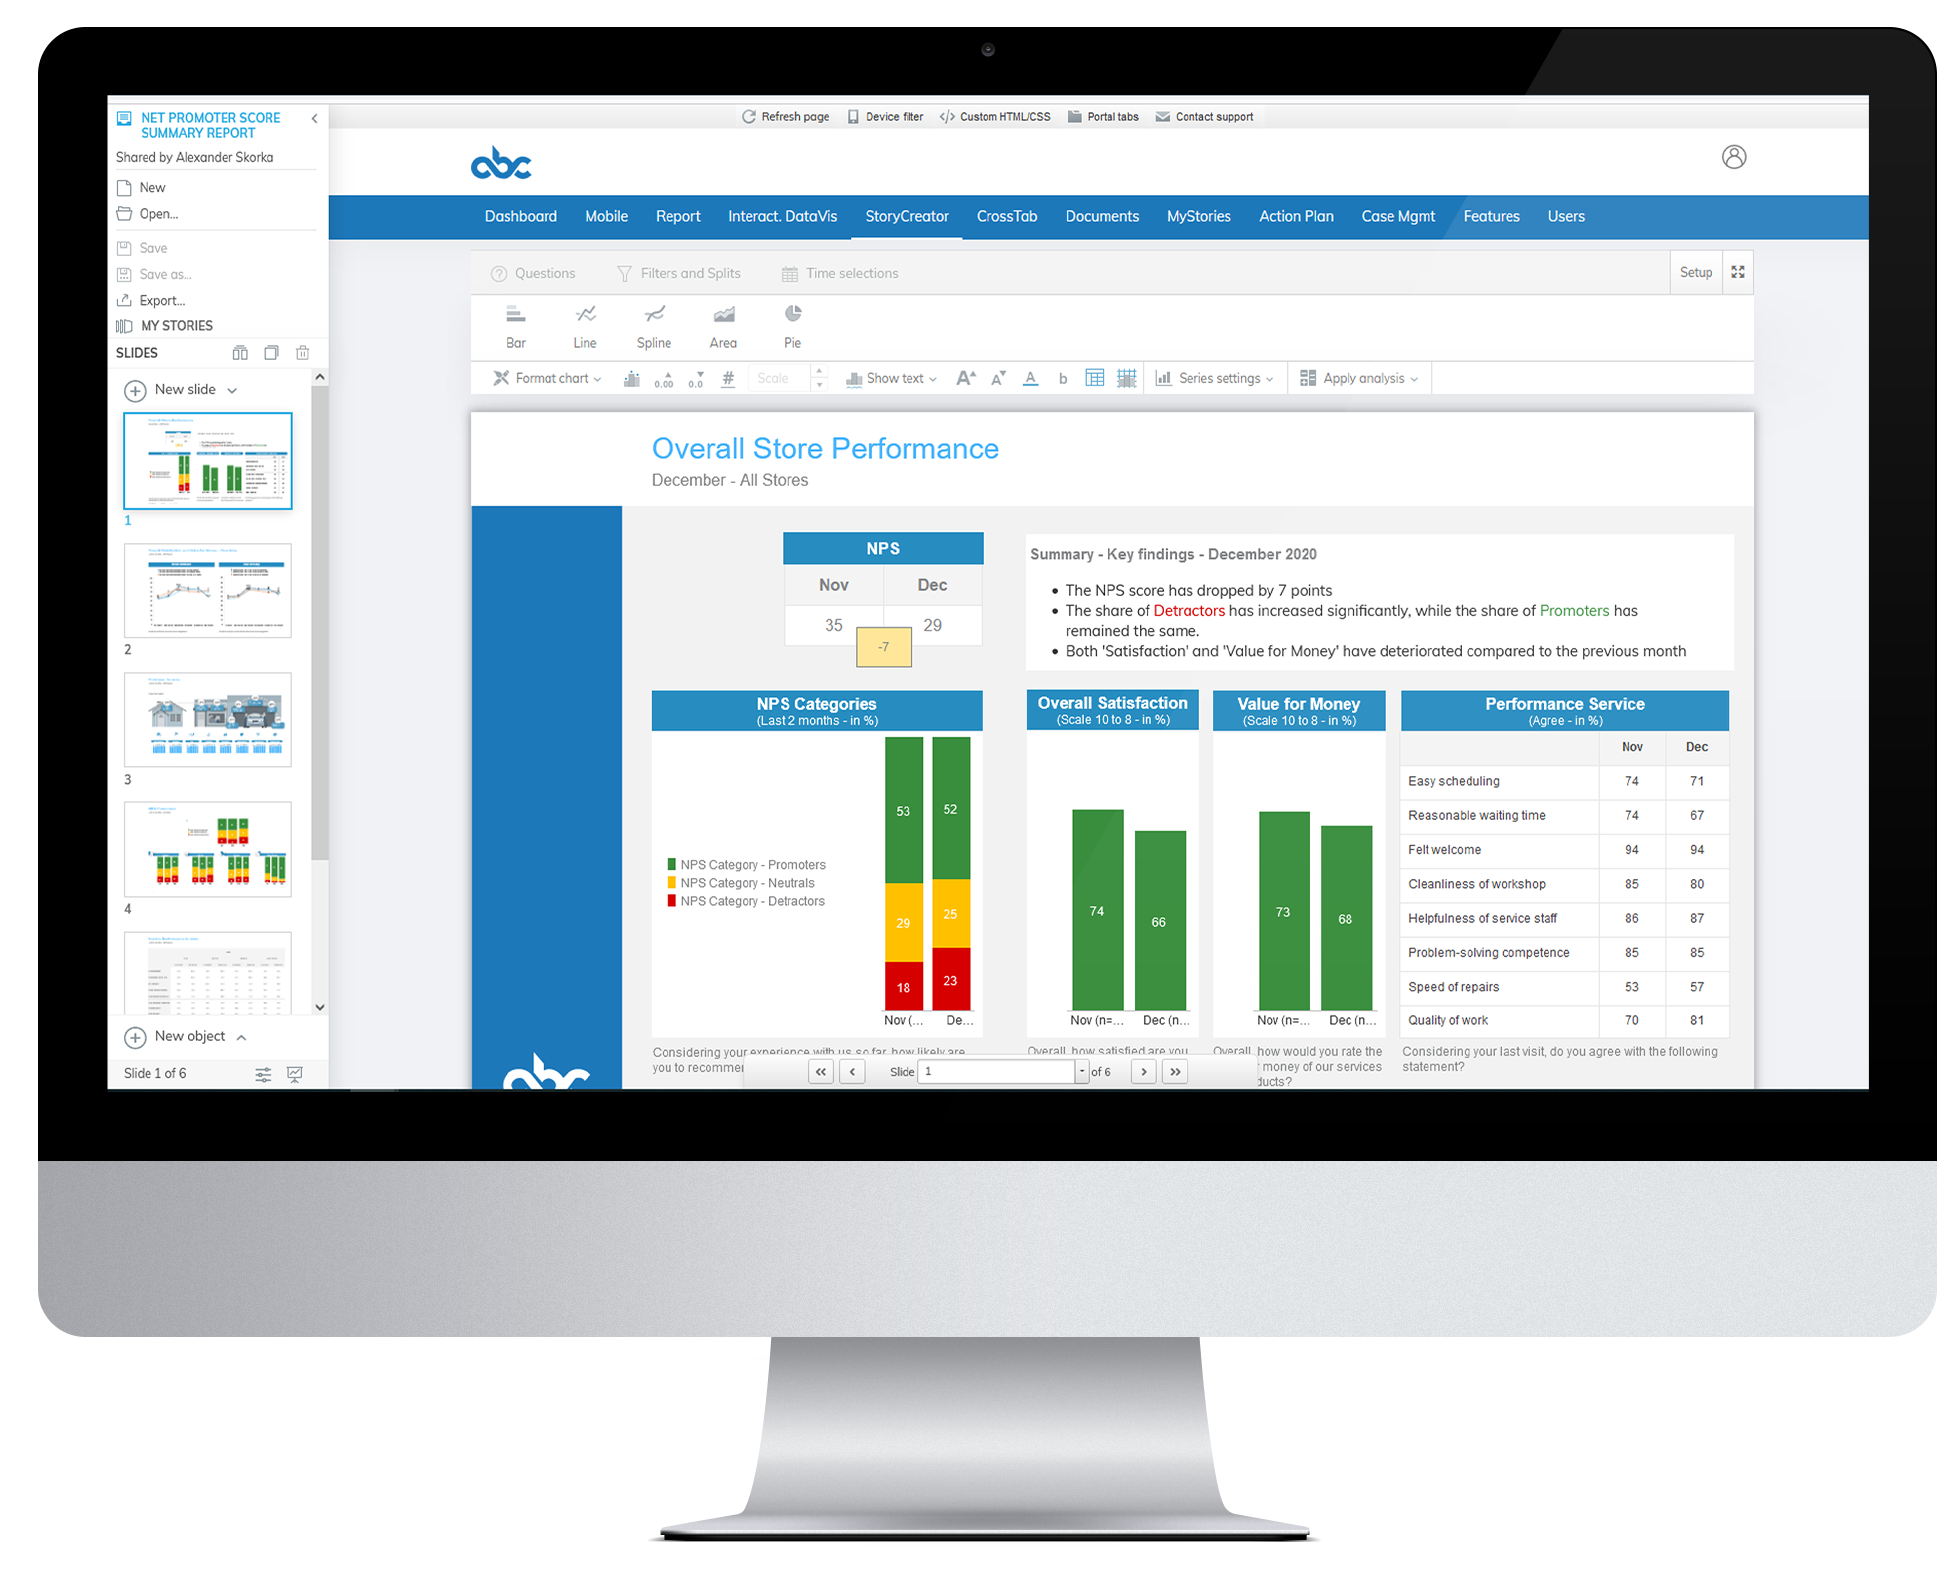
Need a deck? It’s done
Our drag-and-drop workspaces allow you to pull data right onto the page and turn it into tables, charts and infographics. Whether you’re looking to adapt old reports or work completely from scratch, you can deliver straight to the people who need them and export decks direct to PowerPoint, PDF and Excel.
All formats welcome
Import survey data in almost any format, or link directly
to your data sources. What does this mean? Well, you can start your reports the minute fieldwork wraps up.
Key features
Deck creation
Easily create comprehensive chart decks to show key findings without having to create tables first.
Data
Import multiple survey data file types and then clean and recode if required. Seamlessly co-mingle non-survey data – like sales, ad spend, social media – to provide
context.
Template library
Create your own library of objects, slides or reports for faster setup of reports eliminating the need to start from scratch.
Cross tabulation
Drag and drop variables, apply filters, choose calculations, apply stat testing and much more.
Analytics
Apply weighting, stat testing, net creation, computing variables and so much more with built in features to automate common
analytical tasks.
Batch reporting
Generate PowerPoint decks with different data configurations. For example, same deck by country, product etc. And can be programmed to run while user is offline.
Storage
Consolidate all your research files into the reporting system and share amongst users.
Sharing
Export decks and share with the ability to add extensive user access controls and management.
Related resources
Agentic AI: Your personal research assistant
Agentic AI: Your personal research assistant Agentic AI: Your personal research assistant Three years on since the launch of consumer-facing Large Language Models (LLMs), and the AI conversation has travelled from amazement to business function. The initial launch was thrilling; the future is still tantalizingly close with new developments every month, and nowhere is the […]

2026 Retail consumer study
2026 Retail consumer study 2026 Retail consumer study 2026 Retail consumer study AI is no longer a novelty. It’s shaping how people shop and who they trust. This past holiday season marked a turning point. AI moved from behind-the-scenes technology to a front-row role in the customer journey. Shoppers relied on AI to get ideas, […]

AI in retail CX: What shoppers expect and where brands must adapt
AI in retail CX: What shoppers expect and where brands must adapt Webinar synopsis: AI is reshaping the retail customer experience, but consumer trust, adoption, and expectations aren’t evolving at the same pace. Based on findings from Forsta’s latest Retail Pulse research, this webinar explores how shoppers are actually using AI today, where it’s adding […]

Learn more about our industry leading platform
FORSTA NEWSLETTER
Get industry insights that matter,
delivered direct to your inbox
We collect this information to send you free content, offers, and product updates. Visit our recently updated privacy policy for details on how we protect and manage your submitted data.