Voice of the Customer

How Forsta makes VoC more than the sum of its parts
Uncover the right insights and act upon them with Forsta. Our Voice of the Customer (VoC) capabilities give you all you need to understand your customers and give the right people the right tools. So you can make that understanding count. Whether you choose a self-service or managed service, Forsta’s end-to-end platform illustrates the entire customer journey. Every channel, on every device.
Consolidate your data
Break down siloed data sources and unlock customer insight hidden away outside of survey data. Through our extensive range of APIs, you can bring your financial, transactional or any other types of data into one place, and unlock insight that can get overlooked. What’s more, when you bring all your data into one place, you can see save
time and money immediately.
Open every channel
Through Forsta, you can reach your audiences where they are on any device. Deploy sophisticated surveys through multiple channels such as web, mobile, CATI, CAPI and paper. When you want to take things further, you can bring in digital interviews, online communities or even social media listening, facial emotion recognition and much more.
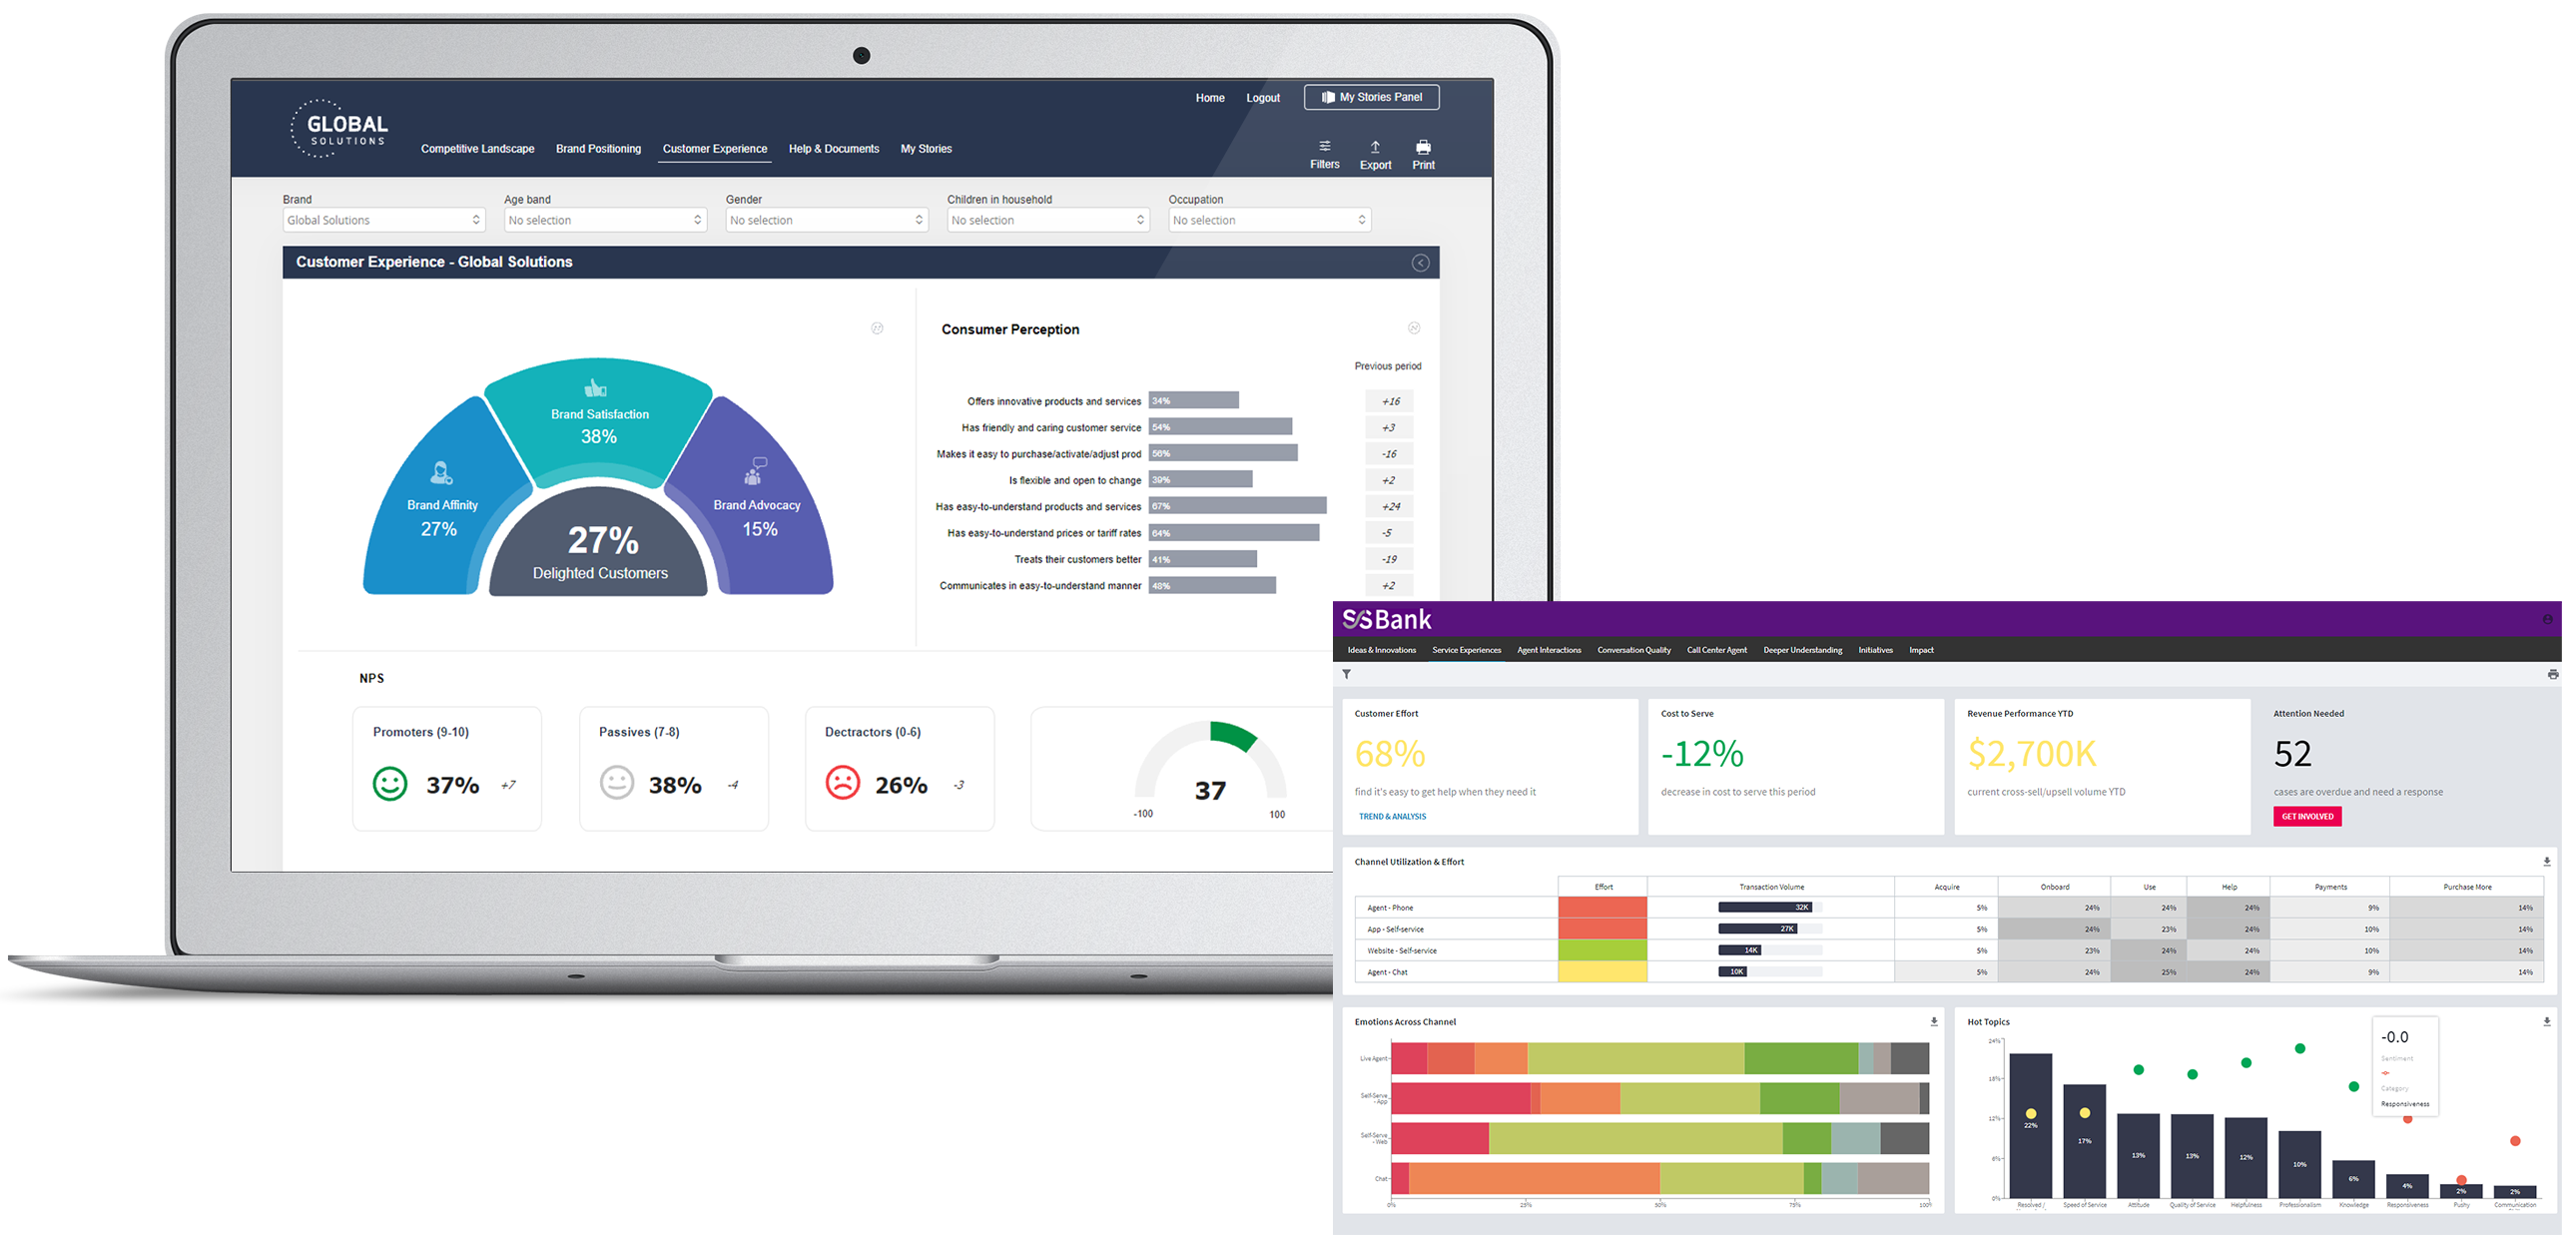
See what your customer sees
Our interactive dashboards provide a customer’s eye view of their experience. You’ll see precisely which areas of the customer journey need attention and act accordingly. You can track performance by line of business, product, region or any other category. Essentially, you’ll make decisions based on true customer and operational data.
Voice of Customer on the go
Manage your VoC program and make actions happen from the palm of your hand. Forsta mobile capabilities keep you up-to-date with the latest insights wherever you may be. For example, if you’re a CX manager responsible for multiple store locations, you can pull up the latest data for that store and region.
Key features
Consolidate data
All your data in one place. Multichannel data collection with surveys, AI-driven text analytics, social listening and more.
Uncover insight
Manage hierarchies and process your data all in one place. Easy-to-use, built-in structured and
unstructured data analytics ensure you can measure metrics and set benchmarks.
Tell a story
Easy dashboard design in your custom branding means you can build real-time, visualized stories.
Action and monitor
Close the loop with individual customers and monitor the impact of your actions from your desktop or mobile device.
Related resources
Getting the balance right for KS&R
Getting the balance right for KS&R Tools used How we helped market research firm KS&R balance keeping their tailor-made approach to research with saving their people time. The challenge Creating custom-made research despite market pressures KS&R needed more than a standard survey solution. Their research required rich customization, razor-sharp methodologies, and the flexibility to reflect real-world decision-making. Off-the-shelf […]

Seamless success: How Harris Poll delivers excellence with Research HX
Seamless success: How Harris Poll delivers excellence with Research HX Seamless success: How Harris Poll delivers excellence with Research HX Harris Poll is a trailblazer in market research, offering clients a blend of custom research, syndicated studies, and thought leadership. From brand tracking and message testing to ad effectiveness studies, their work delivers the insights […]

Everything you need to know about buying market research software
Everything you need to know about buying market research software Webinar synopsis: Tune in for a deep dive into the smartest way to evaluate, select, and secure the right research technology for your organization. We will expose the most common pitfalls, break down the key buying criteria, and show you how to build a rock-solid […]

Learn more about our industry leading platform
FORSTA NEWSLETTER
Get industry insights that matter,
delivered direct to your inbox
We collect this information to send you free content, offers, and product updates. Visit our recently updated privacy policy for details on how we protect and manage your submitted data.