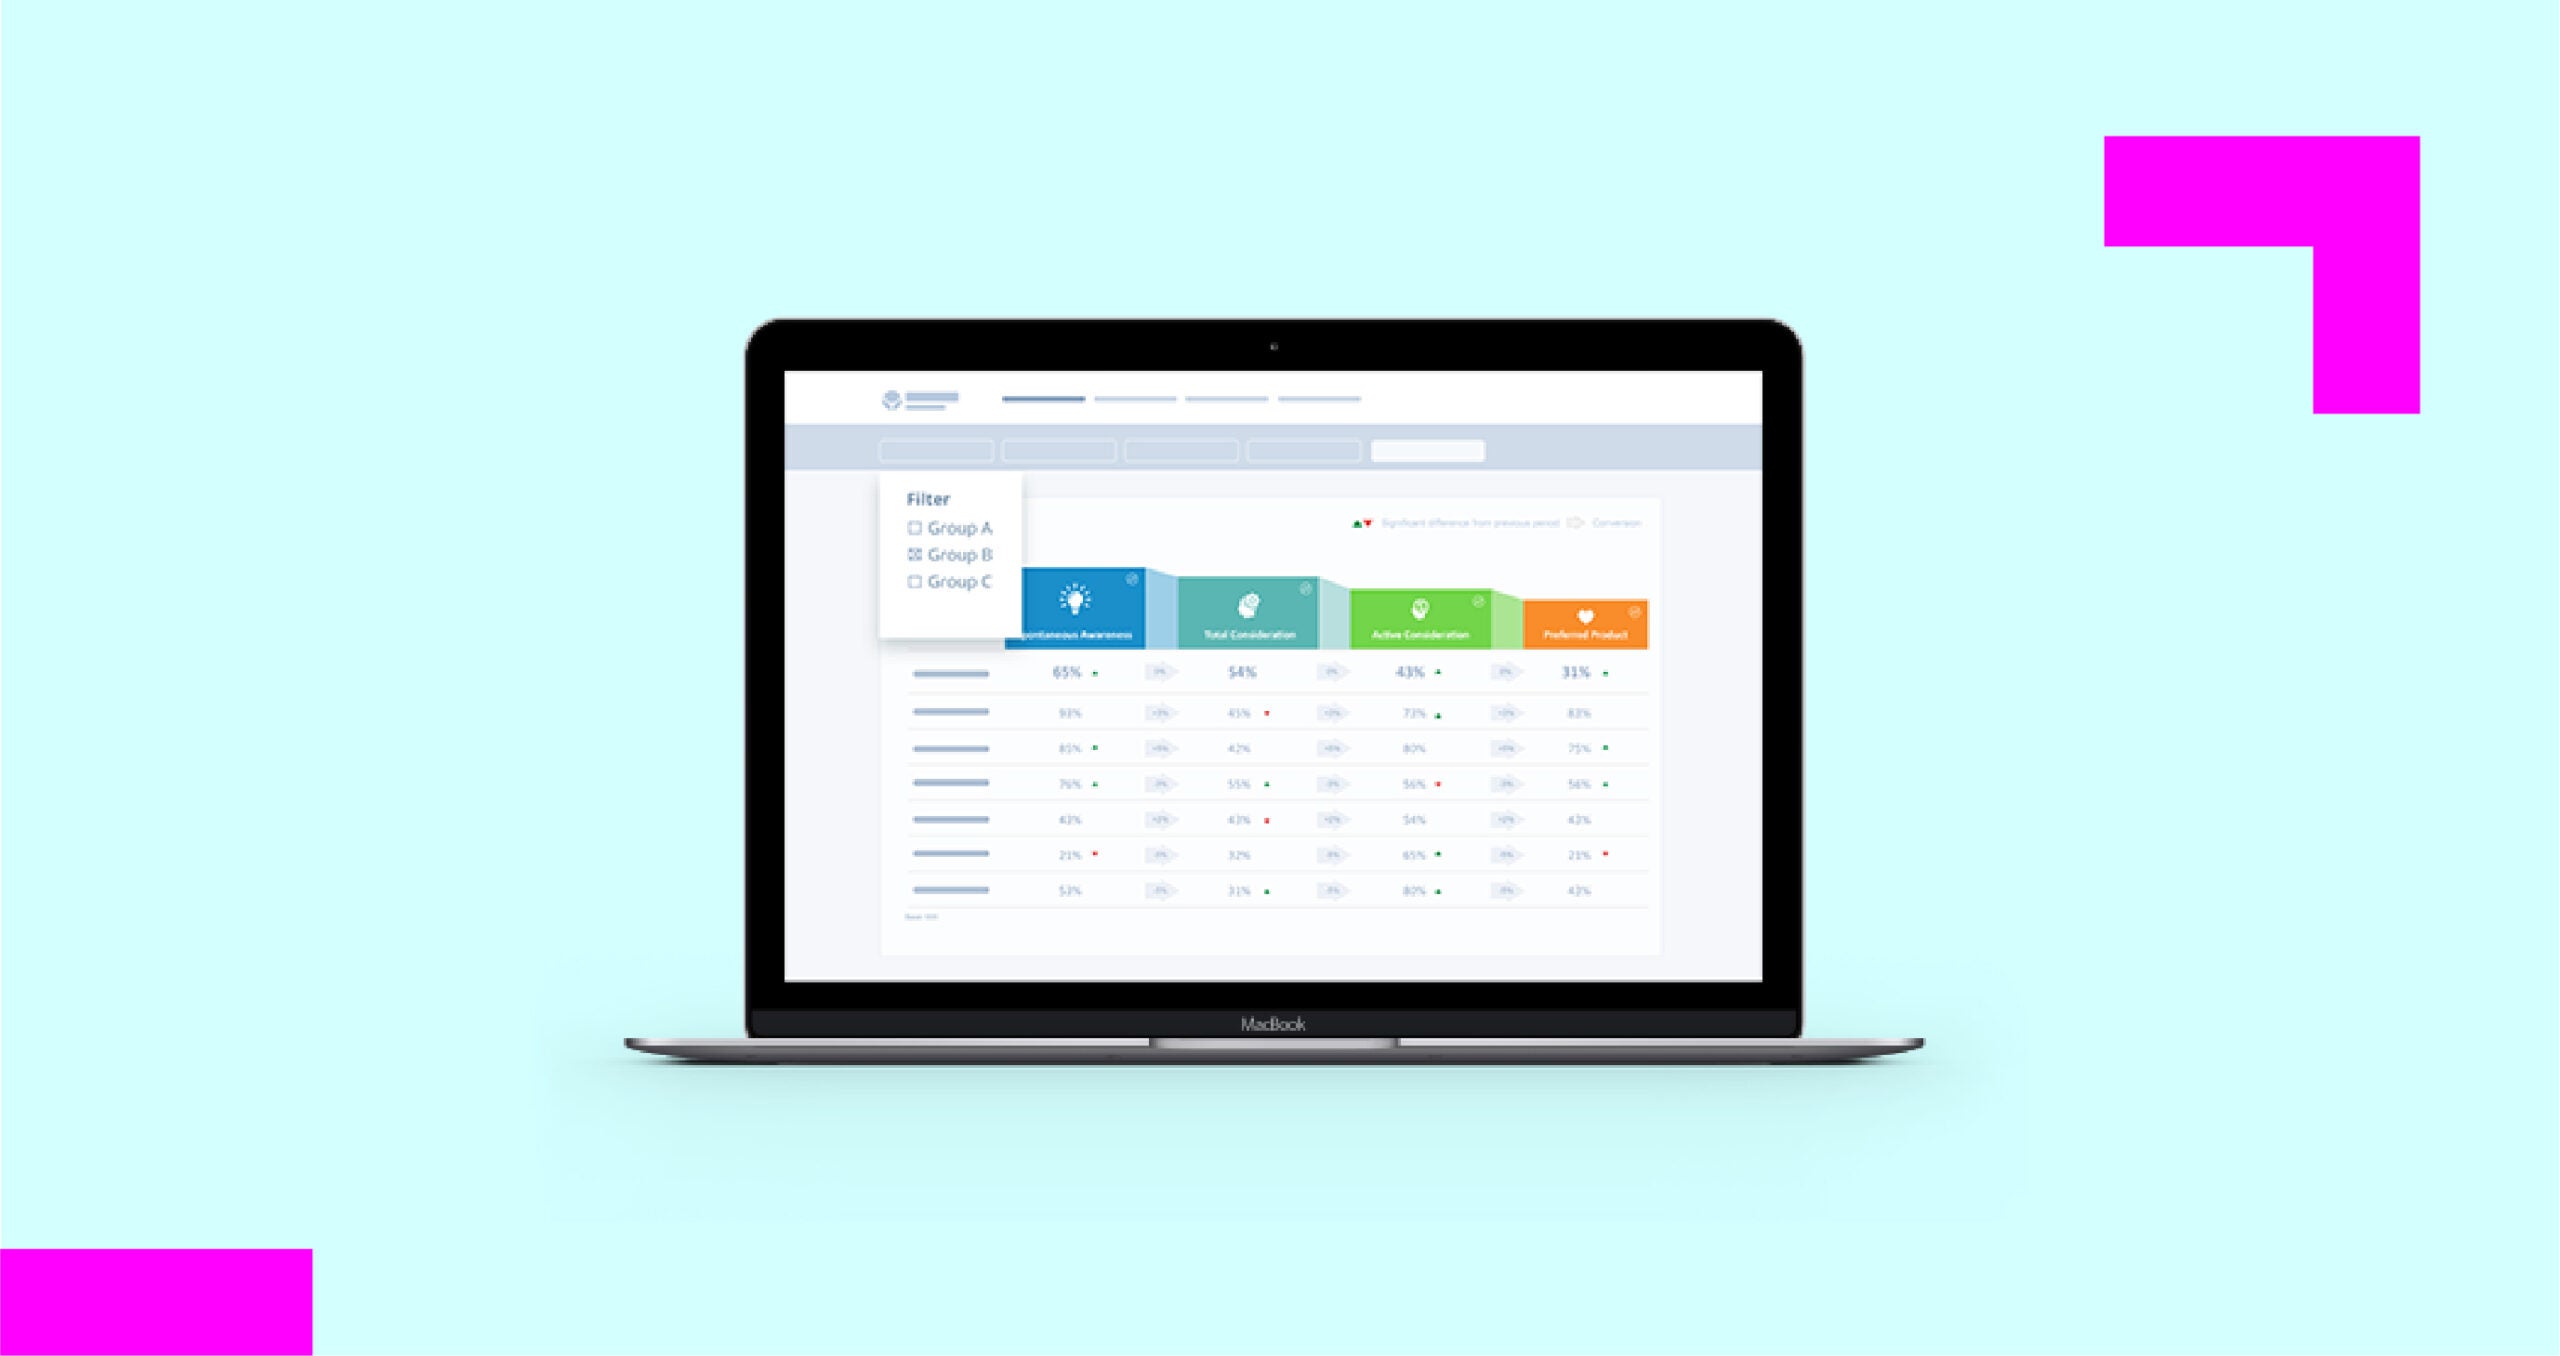
Visualization APIs

Easily integrate data sources to create actionable, visualized stories
What are Forsta APIs?
True insights from Market Research, Voice of the Customer, and Employee Engagement programs rely on the ability to correlate and integrate various sources of feedback as well as information from other business areas. To that end, Forsta’s Visualization provides programmatic access to your organization’s information using simple, powerful, and secure application programming interfaces (APIs).

Benefits of Forsta Visualization APIs
- Straightforward and easy to use relying on industry standard formats
- Save time and money combining data sources faster than ever before
- Easily bridge data silos
- Generate more comprehensive, actionable insights
- Easily create engaging, actionable, visualized stories with your data
How do Forsta APIs work?
True insights from Market Research, Voice of the Customer, and Employee Engagement programs rely on the ability to correlate and integrate various sources of feedback as well as information from other business areas. To that end, Forsta’s visualization provides programmatic access to your organisation’s information using simple, powerful, and secure application programming interfaces (APIs).
How can Forsta’s APIs help my business?
By using industry standards such as JSON, we’ve made APIs straight forward and easy. Forsta’s Visualization APIs allow you to retrieve important data from third-party systems. Once the data is received into Visualization, you can use it to generate comprehensive business insights which can be delivered as actionable, visualized stories.
Want to learn more about Forsta Visualizations?
With Forsta, there’s a lot to love and it’s hard to sum up in a single document. Are you the technical type and would like more detailed information? Of you’d like to learn more about Forsta’s Visualization APIs or any of our other solutions, you can check out our website or give us a call! We’d be delighted to answer all your questions and provide a demonstration at your convenience.
Related resources
Protected: Powered by AI: The new era for research agencies
There is no excerpt because this is a protected post.
Supercharge your business: drive local traffic
Supercharge your business: drive local traffic Join Rio SEO’s Ryan Weber and Tyler Ludwig to discover how Rio SEO’s Local Pages help you dominate local search and convert online searches into real-world customers. We’ll cover best practices for your website locators (store/dealer/agent locators), state pages, city pages, hyperlocal pages, and specialty pages that drive traffic […]

Crushing your CAC: Maximize click-buy-repeat
Crushing your CAC: Maximize click-buy-repeat Webinar synopsis:Are soaring customer acquisition costs shackling your financial potential? Join Zack Hamilton as he shares battle-tested strategies to slash your customer acquisition costs by optimizing your customer’s journey at every touchpoint. Learn how to: Related resources

Learn more about our industry leading platform
FORSTA NEWSLETTER
Get industry insights that matter,
delivered direct to your inbox
We collect this information to send you free content, offers, and product updates. Visit our recently updated privacy policy for details on how we protect and manage your submitted data.