Diving deeper: CX analytics explained

Wouldn’t it be lovely if your business had a crystal ball that would tell you what the future holds and how to improve it? With that information, you could plan the most effective steps to drive revenue or beat out the competition.
Unfortunately, there are no crystal balls in business. But, it doesn’t follow that businesses have no hope for getting insights that enable well-informed, proactive decisions. Analytics is a data-driven, statistically sound way for businesses to identify areas for improvement, predict the future, and identify the best actions to push your business forward.
Defining analytics
Analytics is the systematic computational analysis of data. While the big words make that sound very scary, it is actually quite simply analyzing data for a specific purpose. And that purpose is to unlock the data’s story.
The depth and detail of the story your data tells are directly linked to the type of analysis you conduct. For the purpose of this eBook, we will zoom in on three types of analytics.
These are basic, advanced, and predictive. Each type of analysis is extremely valuable, telling part of your data’s story. Basic analytics provide a general overview of your data, while advanced analytics dive deeper to help you find the ‘why’ and ‘how’ in the data. Predictive analytics go one step further. They provide data-driven, statistically qualified predictions about the future.
In this eBook, we’ll dive deeper into these areas of analytics to help you learn how you can benefit.
Basic analytics
What happened?
Customer satisfaction scores
Advanced analytics
Why did it happen and how can we do better?
Root causes of
customer behaviors
Predictive analytics
What will happen next? What will happen if we change..
Customers at risk
for churn
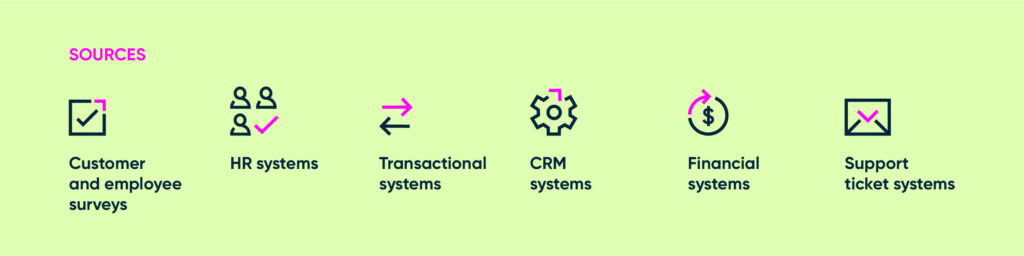
It all starts with collecting the right data
In today’s highly competitive business environment, companies leverage customer analytics to help them identify opportunities to increase revenue, improve operations, and achieve a competitive advantage. The most powerful advanced and predictive analytics, however, hinge on gathering the right combination of new and historic, multi-channel and multi-source feedback, as well as contextual data.
Multi-channel
When it comes to collecting customer feedback, one size does not fit all. There are many touchpoints throughout the customer lifecycle (sales, support, etc.). And there are a variety of channels through which feedback for each touchpoint can be collected. Organizations that do this well will enjoy the benefits of a comprehensive and holistic view of their customer’s experience.

Multi-source
Multi-source data refers to rich feedback and contextual data from a variety of sources. Generally, different types of customer data, such as financial, transactional, etc., are stored in distinct purpose-built systems. Unfortunately, these purpose-built systems alone are unable to provide ‘big picture’ customer insights. The key to unlocking your customer data’s full potential is to integrate information from your purpose built systems with multi-channel feedback data to provide deeper detail and context that feeds accurate decision making and drives organizational improvement.
“Powerful insights are uncovered by linking together data from a variety of sources and channels then seeking statistical relationships across that data”
Sondre Gilmsdal
Forsta Data Scientist & Machine Learning Expert
Here’s how we help
Collecting multi-channel, multi-source data
- Our flexible software platform for Customer Experience, Employee Engagement, and Market Research programs, provides multi-channel data collection so your customers can provide feedback in the way that suits them, driving high response rates and greater insight. But it doesn’t stop there!
- With Forsta’s open architecture design and a range of APIs, there are no barriers to enterprise-wide integration. This means that you can easily bring in data from other business systems, such as Salesforce.com or your financial system, to provide context and enable the discovery of deeper insights.
- SmartHub™ enables you to bring together all of your data sources from every channel into a single hub where the data can be mapped and ultimately analyzed as though it was a single data set. From there, reports, dashboards, and data visualizations can be delivered to the right people in real time.
It all starts with collecting the right data
The data you collect from your selected variety of channels and sources comes in different forms. Generally speaking, the data is either “structured” or “unstructured”. Coupling unstructured and structured data is key to unlocking the deepest customer insights. For example, while structured data has the potential to answer specific questions, unstructured data has the potential to unearth insights into customer behaviors, wants, needs, and opportunities that you may not have considered otherwise.
Structured data
Structured data is highly organized. Generally, each piece of data is standardized and stored in a fixed field within a record, file, or database. Survey questions that provide respondents with a set list of answers from which they can select their response are a good example of structured data. Also, a significant amount of the data found in CRMs, financial systems, or other business systems is structured too. In these systems, the structured data is stored in a dedicated field within the systems and generally has a specific format for recording the data. Structured data is generally easy to report on because it’s so well organized.

Up to 90%
of all digital data
is unstructured!
Some examples of structured data may also include:
- Survey questions
- Customer demographic
information
- Financial information
- Product information
Unstructured data
While structured data is extremely important, structured data alone may not always facilitate the depth of insight you need to realize the true power of analytics.
- CRM notes
- Emails
- Call center data
- Social media, blogs, rating
and review sites - Responses to open-ended
survey questions
Here’s how we help
Dynamic open text question type
While open-ended survey questions can help you collect deeper insights while asking fewer survey questions, getting respondents to provide meaningful detail in their open-ended responses can be a challenge.
Our dynamic open text questions are an excellent solution to this problem. Our Dynamic Open Text questions encourage respondents to provide deeper detail and more meaningful open text responses in two ways. First, each open text field is coupled with a color-coded gauge or status bar measuring the quantity of the feedback and encouraging respondents to provide more detailed responses. Secondly, this question type encourages respondents to provide higher quality responses by automatically identifying important keywords and phrases and asking the respondent to provide additional detail on those topics.
The best part is that this question type is highly configurable, making it easy for you to tailor things like text box sizes, status bar colors, keyword prompts, and the feedback provided to the respondent to suit your unique needs.
Basic data analysis
Once you have the data you need, you are ready to begin analysis! If all forms of analysis are intended to unlock the story behind your data, basic data analysis is the beginning of this story. Basic analysis will unlock “what happened”. While these calculations are considered “basic”, these techniques can reveal very important information.
Results in aggregate
At the highest level, you are able to review all of your quantitative data with no filters or exclusions – displaying the complete aggregated results. This is particularly useful when your goal is to identify top level trends. For example, one common use for results in aggregate is to see how well your business is performing on certain key metrics. Results in aggregate will answer questions like:
- What is the average score for overall satisfaction with
customer services? - What is the mean time for completing a survey?
- What percentage of respondents were promoters?
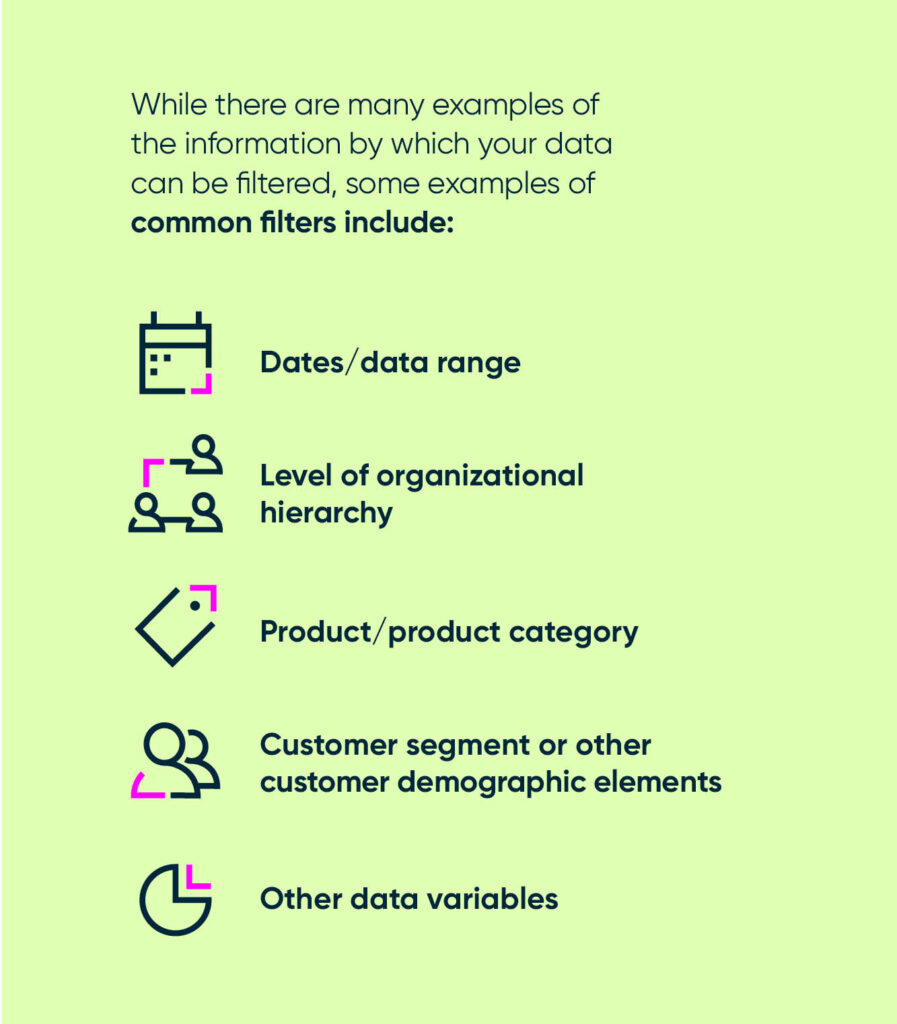
Data filters are a quick and easy way to highlight trends. With data filters, you can temporarily hide information that is not relevant to your current analysis. Using filters, you are able to segment and review relevant data on-the-fly for rapid basic analysis.
Using data filters you can easily answer questions such as: How many survey respondents, who purchased Product X in 2017, rated your customer service as ‘very good’?
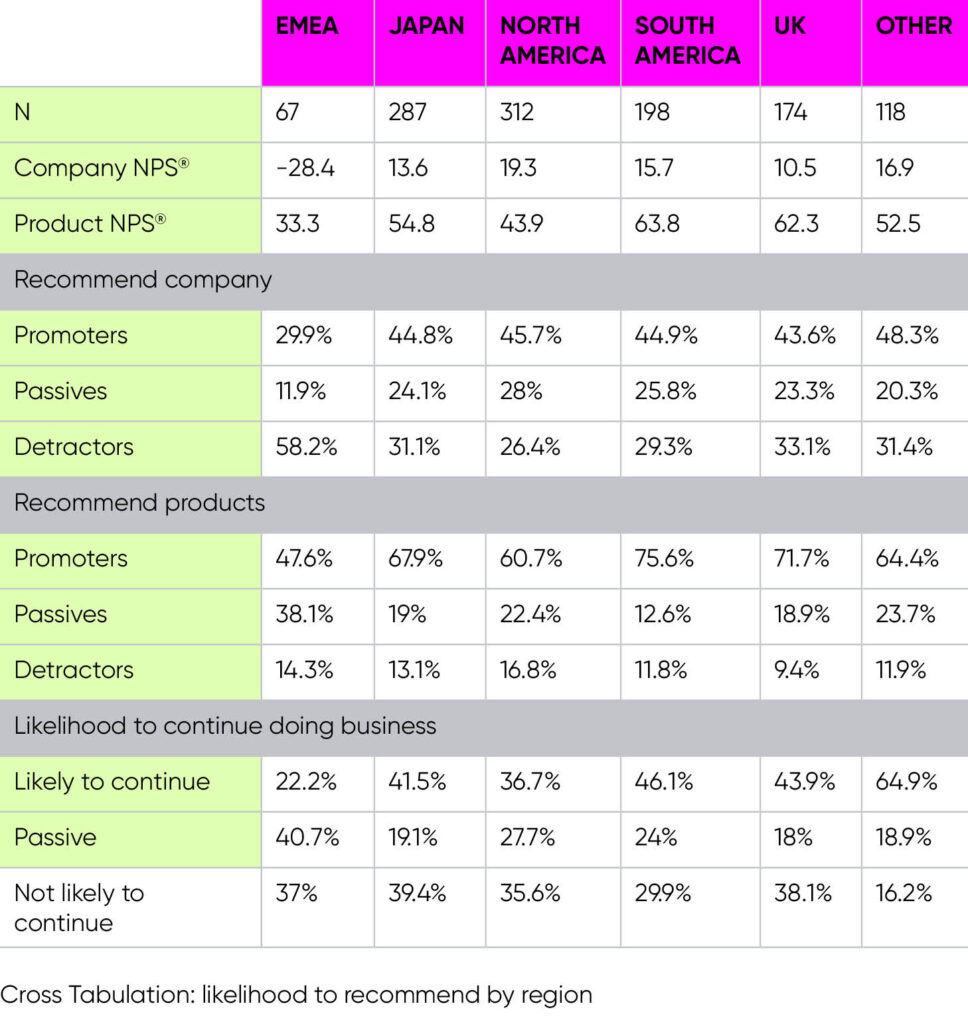
Basic cross tabulations (also known as cross tabs):
Cross tabulations are data tables that make it easy to compare variables at-a-glance. These tables present results for two or more variables in a grid where X and Y axes facilitate comparison across the groups.
For example, with basic cross tabs you can identify the survey respondents, by region, that consider themselves likely to recommend your services to a friend or colleague.
Did you know?
A variable is a piece of information that describes a person, place, or thing. It is called a variable because it can “vary”. For example, if we were describing customers one variable (a piece of information that may vary from customer to customer), is the region in which they live.
Here’s how we can help
Our approach to basic analytics
Recognizing the value of basic data analysis, Forsta supports all your needs for top-level analysis. Our basic analytics capabilities include (but are not limited to):
- Cross-tabs with counts and percentages, mean, median, mode, percentiles, standard deviation, variance, max, min, sum, standard error, affinity
- Support for both weighted and unweighted data
- Significance testing with t-tests, chi-square and z-score.
Best of all, every basic analysis performed on the Forsta
Horizons platform can be conducted in near real-time. And, all types of basic statistical analysis can be run either as needed or at predefined intervals to support your organization’s need for real-time insights
Advanced analytics
Advanced analytics help you dive deeper, answering important business questions and uncovering the “whys” and “hows” hidden in your data. This type of information helps you to make and prioritize business decisions.
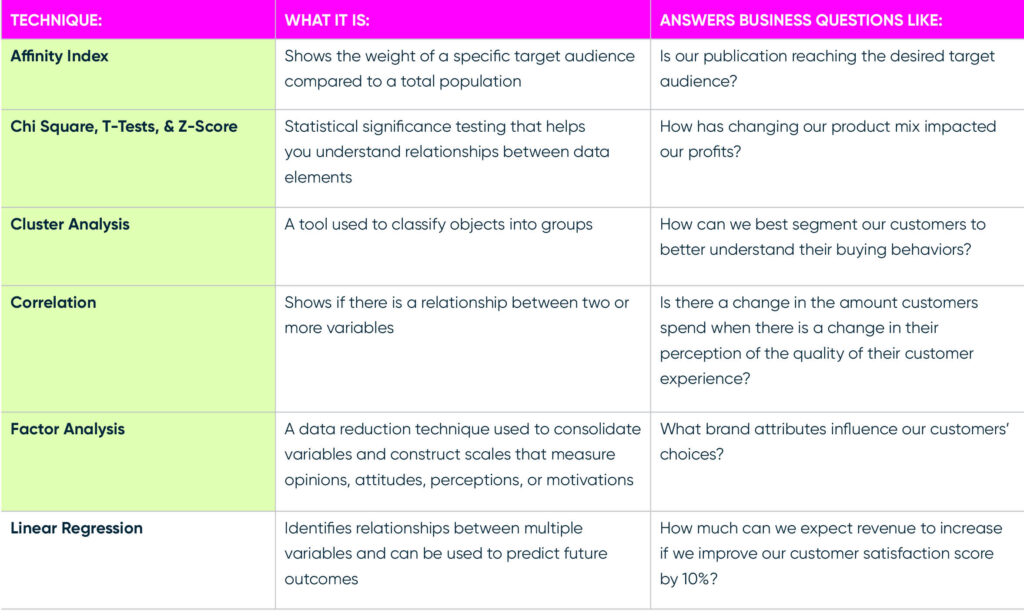
There is a wide range of advanced statistical techniques to support advanced and predictive analytics. Statistical techniques like these can help you more clearly understand your customers’ needs and other pressing business issues. To follow are a few examples of advanced statistical techniques and their potential applications in business.
Did you know?
According to Harvard Business Review, most industries are nowhere close to realizing the true potential of analytics.
Here’s how we can help
Our approach to advanced analytics
We offer advanced statistical analysis such as significance testing, linear regression, factor analysis, cluster analysis, key driver analysis, impact analysis, correlation, and more.
Again, all advanced analysis performed on our platform can be conducted in near real-time. And, statistical analysis can be run as needed or at predefined intervals to support your organization’s need for real-time insights.
While structured data is easily analyzed by the quantitative
methods previously explained, many companies will find that a significant amount of customer feedback is hidden in unstructured text from emails, CRM notes, or social media comments. Text analytics help you draw meaning from unstructured content so
Text analytics
The exponential rise in the volume of unstructured data leads to the inevitable conclusion that it can no longer be ignored if companies want to stay on top. Text is, after all, the primary method for recording thoughts, feelings, and expressing ideas.
Text analytics is an advanced analytic technique that categorizes free form text and assesses the sentiment behind the statements. The information collected from social and text analytics can help to inform decisions about customer experience, product design and performance, competitive intelligence, and generally help you to develop a better understanding of markets and trends.
The magic behind text analytics
The best technologies for text analytics leverage the latest in machine learning to categorize text and assess sentiment within each category. This has many advantages:
- Adaptable: learns from text to quickly adapt to different content styles
- Fast: for large volumes of text, speed and performance are critical
- Forgiving: learning from actual text makes it more forgiving of poor grammar or spelling
- Language agnostic: adding a new language simply requires a large amount of text and the linguistic knowledge to provide seed words for positive and negative sentiment there’s no need to develop the software to handle the different grammatical rules.
Here’s how we can help
Forsta Genius is an advanced text analytics platform that helps you draw meaning from unstructured content by categorizing feedback and measuring its sentiment. It’s tightly integrated with our flexible software platform for Customer Experience, Employee Engagement, and Market Research programs, so you can easily combine structured data from surveys and other sources with the depth of insight and unprecedented level of detail only available in
open-ended feedback.
Predictive analytics
Predictive analytics is the final chapter in your data’s story.
This form of analysis helps organizations predict what happens next In more technical terms, predictive analytics helps you make statistically probable predictions about the future enabling you to make the right decisions and prioritize those decisions based on hard data.
In the world of customer experience, predictive analytics helps you to identify data patterns to uncover risks and opportunities through an analysis of customer data. It can help you answer questions such as:
- What is the impact of changes I want to make to the business?
- Which customers are at risk for churn?
- Where are the up-sell or cross-sell opportunities?
- What will my revenue be next year if I increase my NPS by 10 points?
How the predictive magic happens
The primary tool for predictive analytics is a regression analysis. Based on a hypothesis, a regression analysis will measure the relationship between a dependent variable and one or more independent variables to help you identify the degree to which each independent variable affects the dependent variable. It’s not as complicated as it sounds, really! Consider this one example:
My hypothesis: NPS, income, number of visits to our website (independent variables) are statistically correlated with the purchase of our company’s widget (dependent variable).
What I can learn: A regression analysis lets you calculate the degree to which each independent variable (NPS, income, number of website visits) affects your customers’ purchase behavior. With that, you can see the “importance” of each independent variable to their purchase decision.
Furthermore, you can use that “importance” as a model to predict the likelihood that other, similar customers will also purchase your widget.
This kind of information can really help facilitate up-selling
and cross-selling activity!
Did you know?
One example of simple predictive analytics that you may already be using is a sales forecast. A sales forecast provides predictions about future unit sales based on past sales data. With this information, your sales teams develop a strategy to drive growth.
Here’s how we can help
Our approach to predictive analytics
We offer predictive statistical analysis based on regression, as is best practice. To support your organizations’ need for real-time insights, all predictive analysis performed on our platform can be conducted in near real-time and analysis can be run either as needed or at predefined intervals.
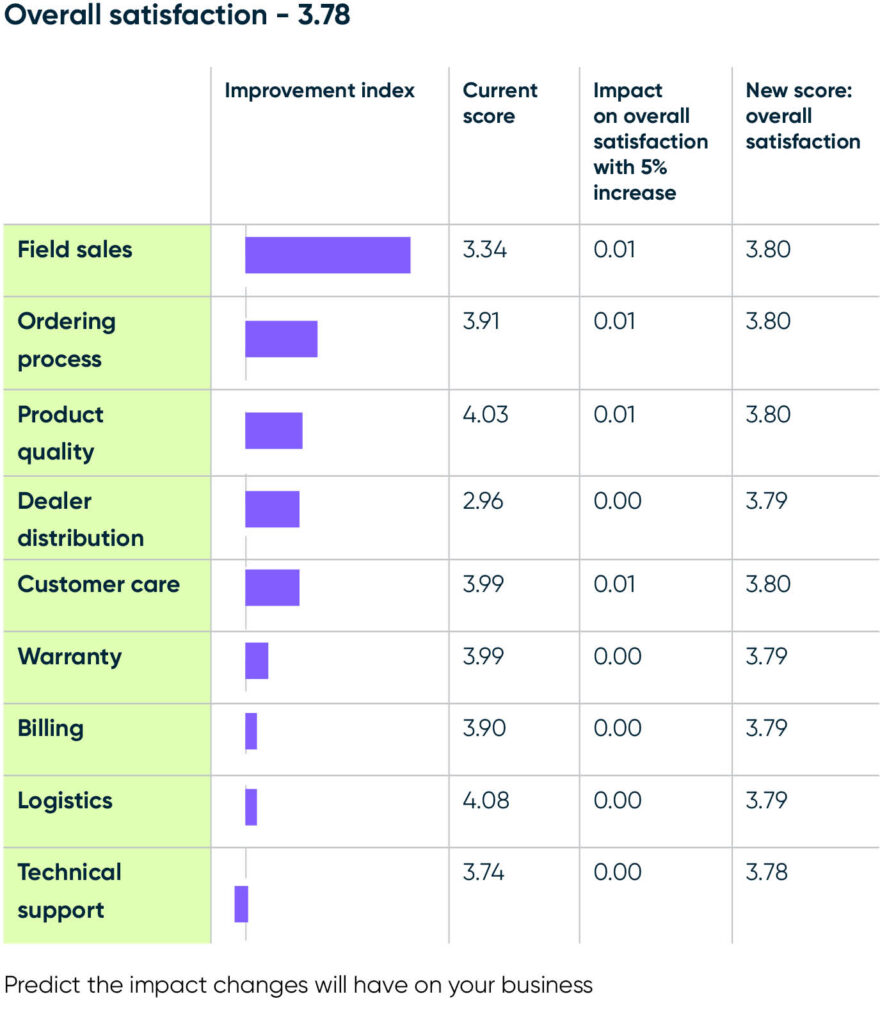
Best practice use case: What-if analysis
One of the most powerful predictive analytics techniques in business is an impact analysis. Devised using “what-if” functions applied to a regression analysis, you are able to determine the impact of change before you actually make the change – eliminating a significant amount of risk associated with making business changes blindly. Analysis like these can also make it easier to prioritize changes when resources are limited (and, let’s face it – we all have limited resources).
Consider this example of how you can use an impact analysis:
A company found that an increase in overall customer satisfaction results in an increase in revenue annually. With the goal of increasing revenue, they conduct an impact analysis to identify which aspects of the customer experience they need to improve to realize the highest
revenue improvement.
Telling your data’s story
Now that you know more about analytics and how they can help you find deeper insights in your customer data, you need to think about what’s next. Simply identifying insights is just not enough.
Insights must be shared so they can be the driving force behind organizational improvements that drive Return on Investment.
To achieve this, the insights you share must be:
- Role-based and real-time: Ensure that those who consume the insights you provide are getting the information they need in real time – no more, no less. Too much data can be overwhelming, too little data doesn’t drive organizational improvements, and old data is simply useless. Real-time, role-based reporting ensures that the right people have access to the information they need when they need it.
- Interactive: Provide high-level insights that allow your users to drill down to deeper detail. Encouraging users to explore the detail behind your insights will help them better understand the information you are presenting as it applies to their areas of influence.
- Highly visual: It is imperative to make reports easy for your users to understand and compelling enough to drive action. Studies have shown that data visualization consistently improves understanding and is more likely to drive action than numbers alone.
There is no easier or more powerful way to achieve this than by leveraging highly visual, real-time, interactive, role-based
dashboards. Dashboards make it easy to operationalize feedback to drive organizational changes that increase revenue, reduce costs, and promote culture change.
Our approach to reporting, dashboards, and
visualization
Forsta’s comprehensive reporting and action suite provides
organizations with access to everything they need for reporting, data visualization, dashboarding, and alerting on all of the statistical analysis you conduct, whether basic, advanced, or predictive.
- Modules such as instant analytics, active dashboards, and discovery analytics are easy-to-use, scalable, out-of-thebox solutions that support fundamental reporting and data exploration needs.
- Reportal is a wholly customizable reporting, dashboarding, and portal development platform for clients who need an extremely powerful tool that will let them slice, dice, and visually display data in unique ways.
- Action management watches the results for you, assigns issues, notifies the correct department or individual, and allows you to report on the company’s case load and ROI.
Using our range of modules, you can:
- Realize excellent ROI from your feedback and research efforts
- Reduce the time, cost, and complexity associated with analysis
- Break down the data silos that prevent your organization from achieving results
- Deliver business insights faster, directly to those who need it
- Engage more people across your business
- Drive immediate corrective actions based on the insights uncovered.
More customer stories
Getting the balance right for KS&R
Getting the balance right for KS&R Tools used How we helped market research firm KS&R balance keeping their tailor-made approach to research with saving their people time. The challenge Creating custom-made research despite market pressures KS&R needed more than a standard survey solution. Their research required rich customization, razor-sharp methodologies, and the flexibility to reflect real-world decision-making. Off-the-shelf […]

Seamless success: How Harris Poll delivers excellence with Research HX
Seamless success: How Harris Poll delivers excellence with Research HX Seamless success: How Harris Poll delivers excellence with Research HX Harris Poll is a trailblazer in market research, offering clients a blend of custom research, syndicated studies, and thought leadership. From brand tracking and message testing to ad effectiveness studies, their work delivers the insights […]

Everything you need to know about buying market research software
Everything you need to know about buying market research software Webinar synopsis: Tune in for a deep dive into the smartest way to evaluate, select, and secure the right research technology for your organization. We will expose the most common pitfalls, break down the key buying criteria, and show you how to build a rock-solid […]

Learn more about our industry leading platform
FORSTA NEWSLETTER
Get industry insights that matter,
delivered direct to your inbox
We collect this information to send you free content, offers, and product updates. Visit our recently updated privacy policy for details on how we protect and manage your submitted data.