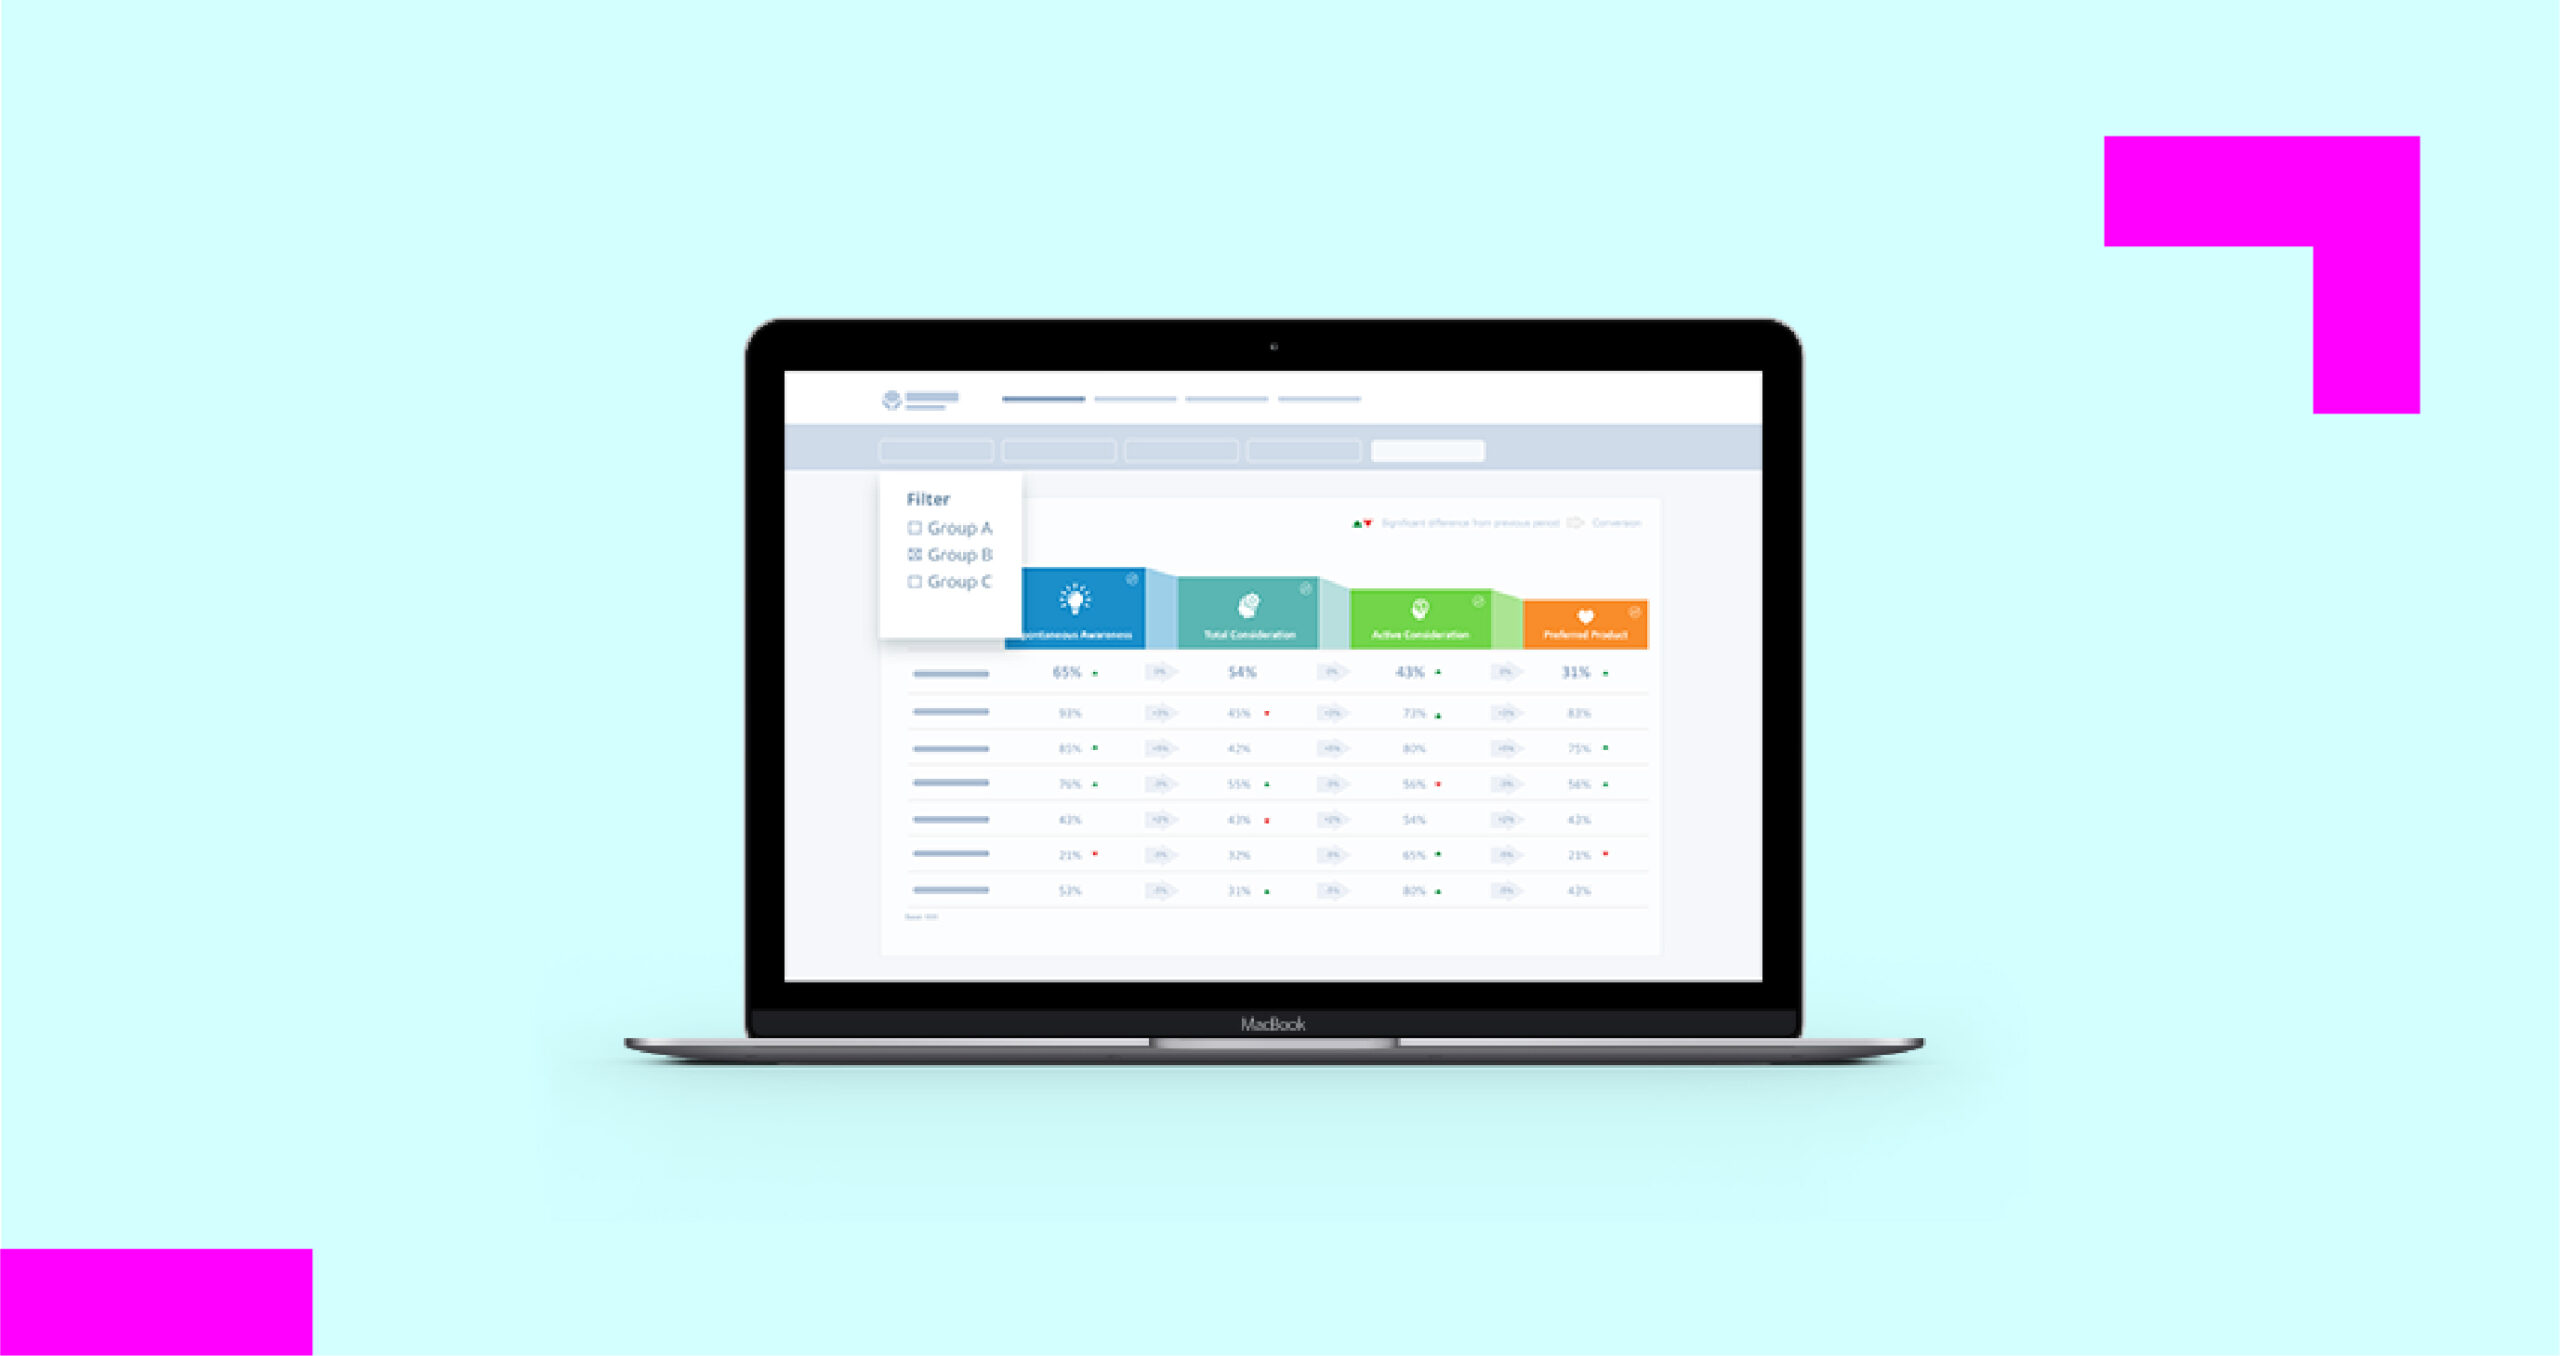
Visualization APIs

Easily integrate data sources to create actionable, visualized stories
What are Forsta APIs?
True insights from Market Research, Voice of the Customer, and Employee Engagement programs rely on the ability to correlate and integrate various sources of feedback as well as information from other business areas. To that end, Forsta’s Visualization provides programmatic access to your organization’s information using simple, powerful, and secure application programming interfaces (APIs).

Benefits of Forsta Visualization APIs
- Straightforward and easy to use relying on industry standard formats
- Save time and money combining data sources faster than ever before
- Easily bridge data silos
- Generate more comprehensive, actionable insights
- Easily create engaging, actionable, visualized stories with your data
How do Forsta APIs work?
True insights from Market Research, Voice of the Customer, and Employee Engagement programs rely on the ability to correlate and integrate various sources of feedback as well as information from other business areas. To that end, Forsta’s visualization provides programmatic access to your organisation’s information using simple, powerful, and secure application programming interfaces (APIs).
How can Forsta’s APIs help my business?
By using industry standards such as JSON, we’ve made APIs straight forward and easy. Forsta’s Visualization APIs allow you to retrieve important data from third-party systems. Once the data is received into Visualization, you can use it to generate comprehensive business insights which can be delivered as actionable, visualized stories.
Want to learn more about Forsta Visualizations?
With Forsta, there’s a lot to love and it’s hard to sum up in a single document. Are you the technical type and would like more detailed information? Of you’d like to learn more about Forsta’s Visualization APIs or any of our other solutions, you can check out our website or give us a call! We’d be delighted to answer all your questions and provide a demonstration at your convenience.
Related resources
Liberty Hardware’s in-house research team streamlined strategy
Liberty Hardware’s in-house research team streamlined strategy How Liberty Hardware’s in-house team streamlined strategy The challenge In the fast-moving world of home improvement retail, product appeal and placement can make or break success. For Liberty Hardware, a key player in bath accessories, cabinet hardware, and home organization, research has always played a vital role in […]

Adapt to thrive: AI and the market researcher
Adapt to thrive: AI and the market researcher Webinar synopsis: The future doesn’t matter. It’s what you do today that will allow you to excel in the dynamic, thrilling, and sometimes turbulent market research ecosystem. AI and automation are rewriting what it means to deliver value. Stakeholders cry out for insights yesterday, driven by their […]

Human Experience in the AI era: A guide for insights leaders
Human Experience in the AI era: A guide for insights leaders Human Experience in the AI era: A guide for insights leaders Future or flatline? Nearly 65% of market research teams and agencies use AI for work today. And it feels like AI is reinventing the industry faster than any of us can keep up. […]

Learn more about our industry leading platform
FORSTA NEWSLETTER
Get industry insights that matter,
delivered direct to your inbox
We collect this information to send you free content, offers, and product updates. Visit our recently updated privacy policy for details on how we protect and manage your submitted data.