Interactive dashboards

See it all in an instant
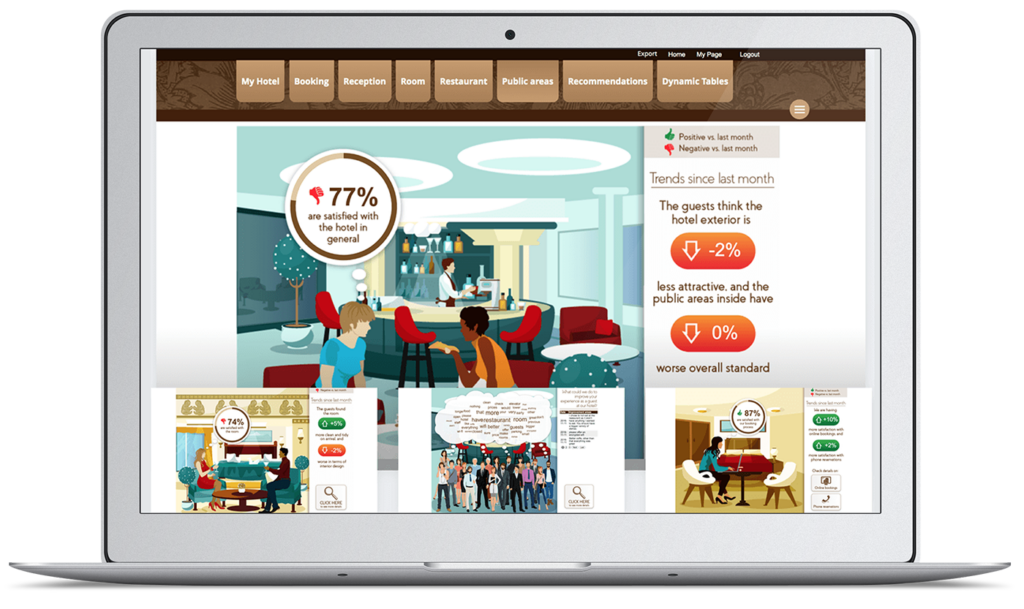
Create dynamic, living visuals that can be adjusted and explored. Dynamic, online dashboards update with new data automatically, giving the full picture of your data and shareable with anyone, on any device.
Stories you can see
Turn lists of names and numbers into a living, breathing entity. A template library with drag-and-drop tools helps you reinvent your reports from black and white data, to something colorful, visual, interactive and accessible on multiple devices.
On the beat
Data constantly shifts and you can watch it shift in real-time with our dashboards. Graphics will refresh themselves live, alert you when something looks wrong and you can react as fast as your data changes.
Views that move
Different people, need different dashboards. Tailor your dashboards to specific individuals so they only see what they needs to see without any noise. Our dashboards seamlessly fit onto whatever device you’re
using through device recognition capabilities. Finally, dynamic filtering allows you to question your data, and
gain a host of different information depending on how you decide to slice and dice.
Key features
Template library
Objects, slides, icons and shapes are on hand to help you build visual dashboards.
Flexible sharing
Deliver dashboards to anyone, on any device and let them delve into the data with dynamic filters. You control what info different people see and what they can do with it.
Live data
Dashboards update themselves with each fresh wave of data, so you always know what’s happening as it’s happening.
Drag-and-drop build
No programming needed. Drag-and-drop to create dashboards intuitively.
Related resources
Liberty Hardware’s in-house research team streamlined strategy
Liberty Hardware’s in-house research team streamlined strategy How Liberty Hardware’s in-house team streamlined strategy The challenge In the fast-moving world of home improvement retail, product appeal and placement can make or break success. For Liberty Hardware, a key player in bath accessories, cabinet hardware, and home organization, research has always played a vital role in […]

Adapt to thrive: AI and the market researcher
Adapt to thrive: AI and the market researcher Webinar synopsis: The future doesn’t matter. It’s what you do today that will allow you to excel in the dynamic, thrilling, and sometimes turbulent market research ecosystem. AI and automation are rewriting what it means to deliver value. Stakeholders cry out for insights yesterday, driven by their […]

Human Experience in the AI era: A guide for insights leaders
Human Experience in the AI era: A guide for insights leaders Human Experience in the AI era: A guide for insights leaders Future or flatline? Nearly 65% of market research teams and agencies use AI for work today. And it feels like AI is reinventing the industry faster than any of us can keep up. […]

Learn more about our industry leading platform
FORSTA NEWSLETTER
Get industry insights that matter,
delivered direct to your inbox
We collect this information to send you free content, offers, and product updates. Visit our recently updated privacy policy for details on how we protect and manage your submitted data.