3 Tips for better mobile surveys

With the average number of mobile survey completes ranging from 30% to 60%, designing for mobile is not optional.
In this most recent research on research, jointly conducted by Dynata, Forsta and MaritzCX, we explore the survey presentation of three commonly used question types: grids, Net Promoter Score, and lists.
Using a multi-cell design, we tested each presentation condition in a survey among 2280 participants. We investigated data comparability, data quality and participant experience.
Did you know…
Smartphone Ownership
98% of Millennials and 95% of Gen X own smartphones, with Boomers not far behind at 85% (Dynata Global Trends Report)

98%
Millennials

23%
Gen X

85%
Boomers
Global Web Traffic
In Q1 of 2019, mobile devices (excluding tablets) generated 49% percent of global website traffic (Statista)

49%
Smartphone only internet
One-in-five Americans are now ‘smartphone only’ internet users at home, up 7% since 2015 (Pew Internet)

Global Web Traffic
Mobile ad spend will top $93 billion in 2019, which is $20B more than TV (eMarketer)

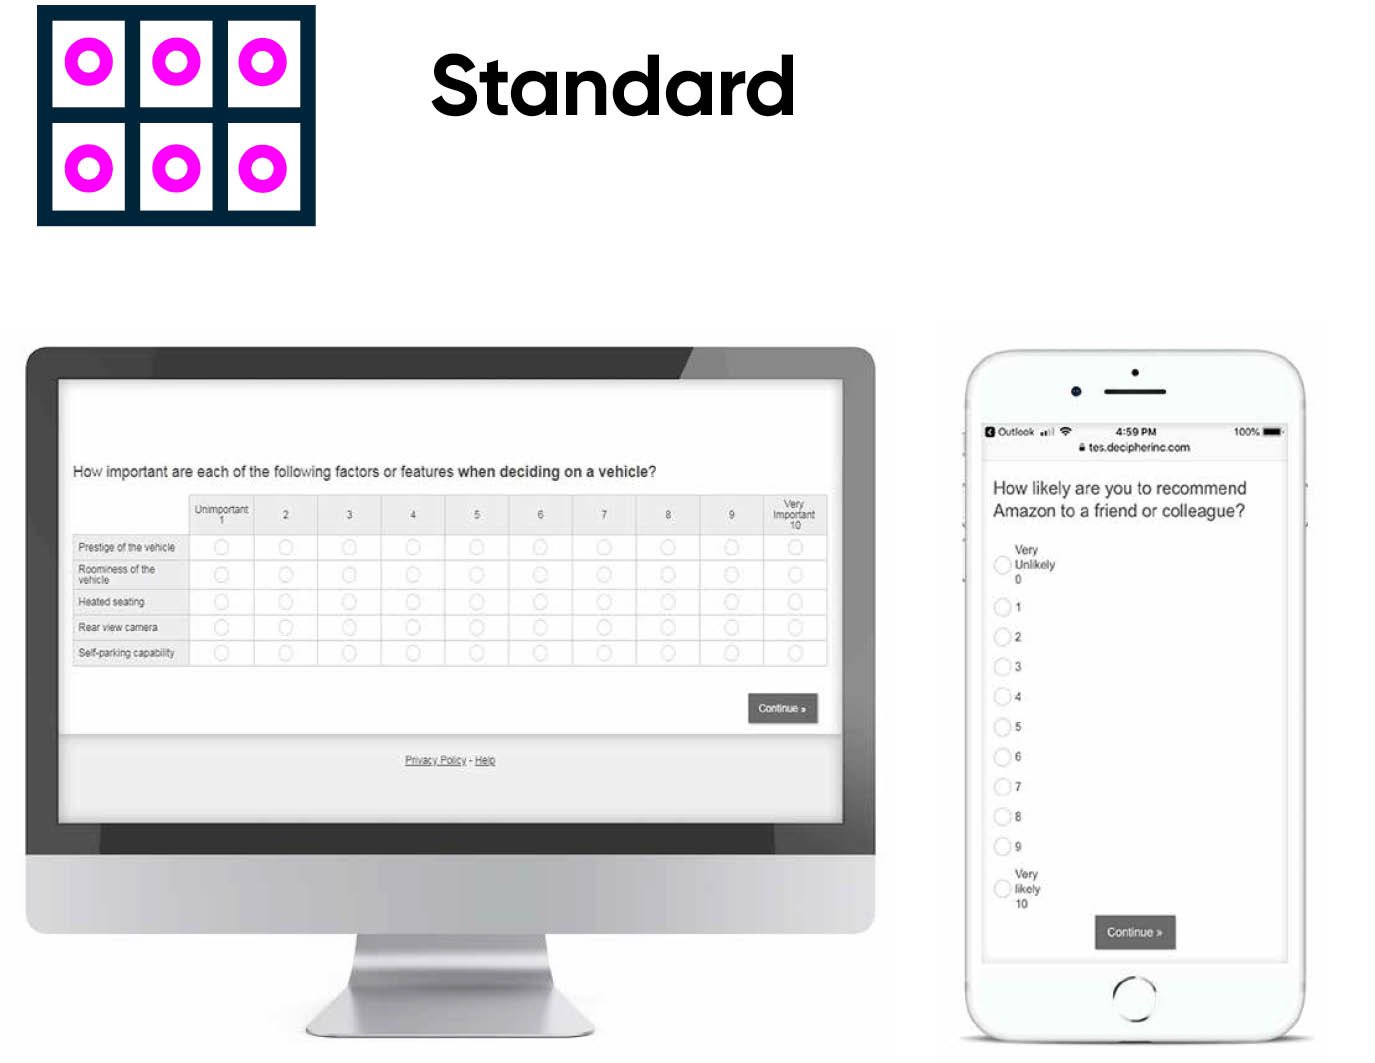
1. Grids
Grids are one of the most commonly used question types, yet we know they are problematic, often receiving high levels of straight-lining (where participants select the same response option for all items in the grid) and survey dropouts.
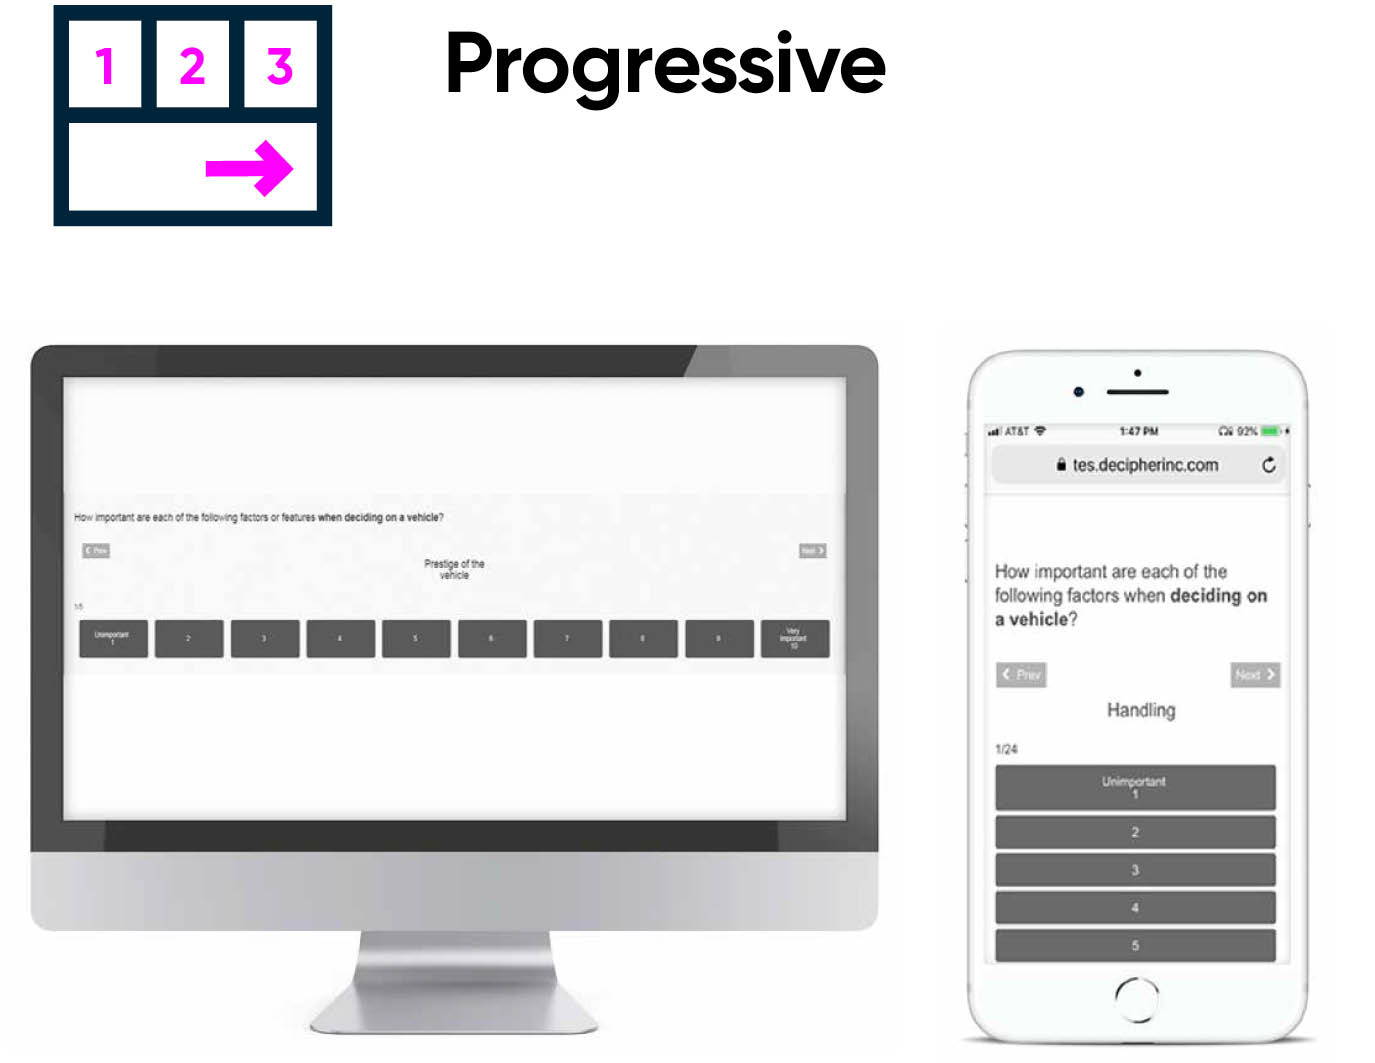
We tested three ways of displaying grids (standard matrix grid, grid bars and progressive, also known as card sort within Forsta Surveys.
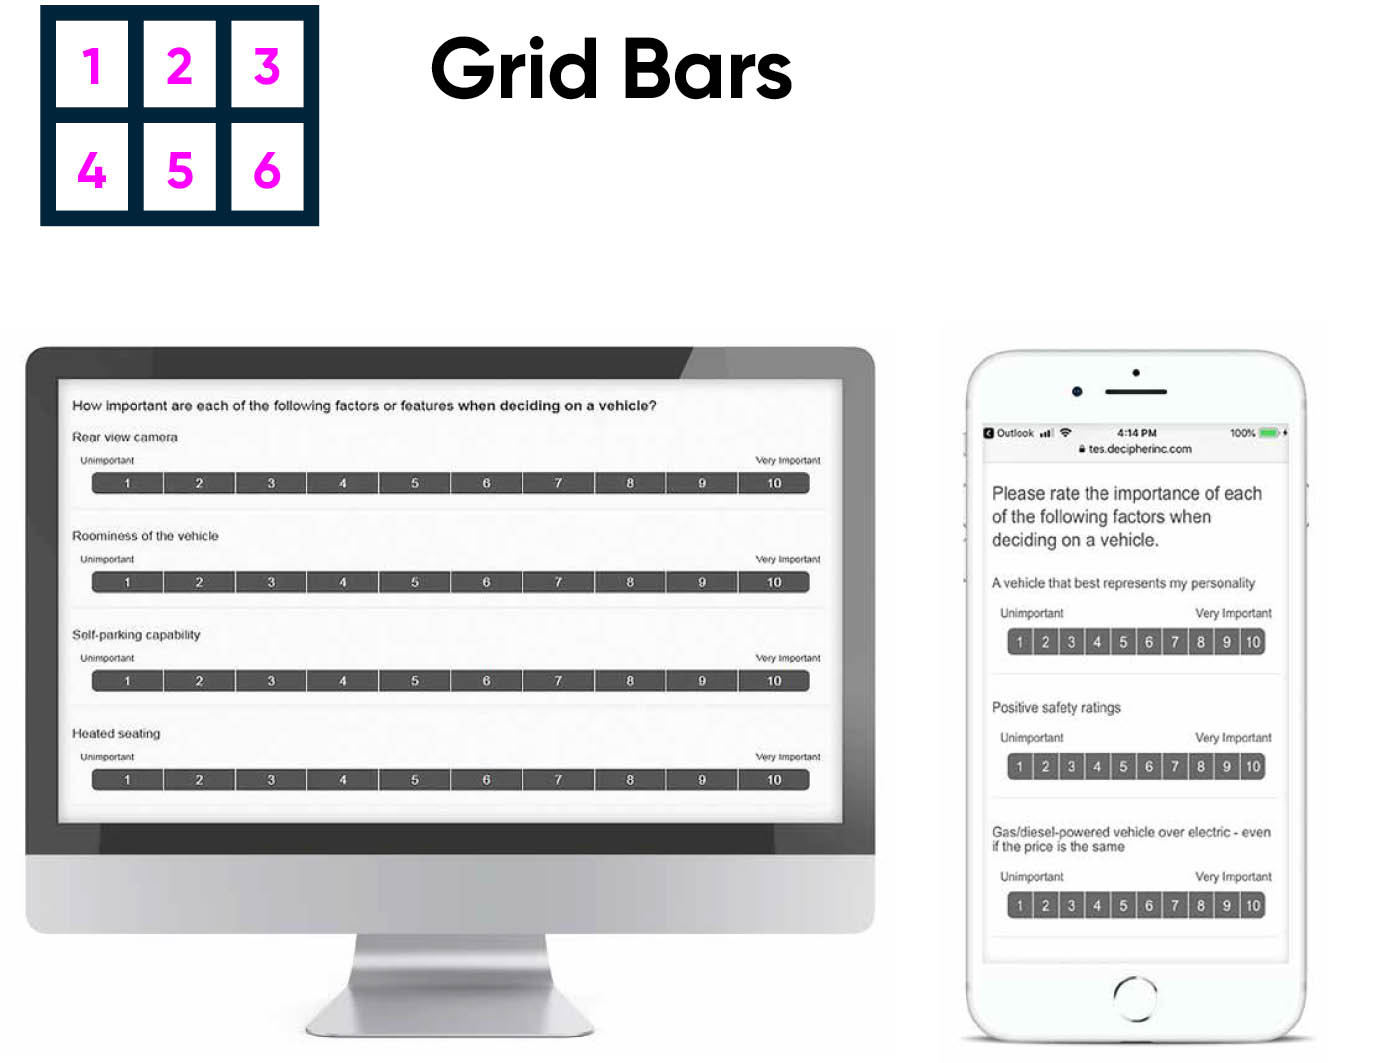
The Recommended Approach
- No significant score differences across devices
- Lowest % mobile straight liners
- Highest completion rates (comparable with grid bars)
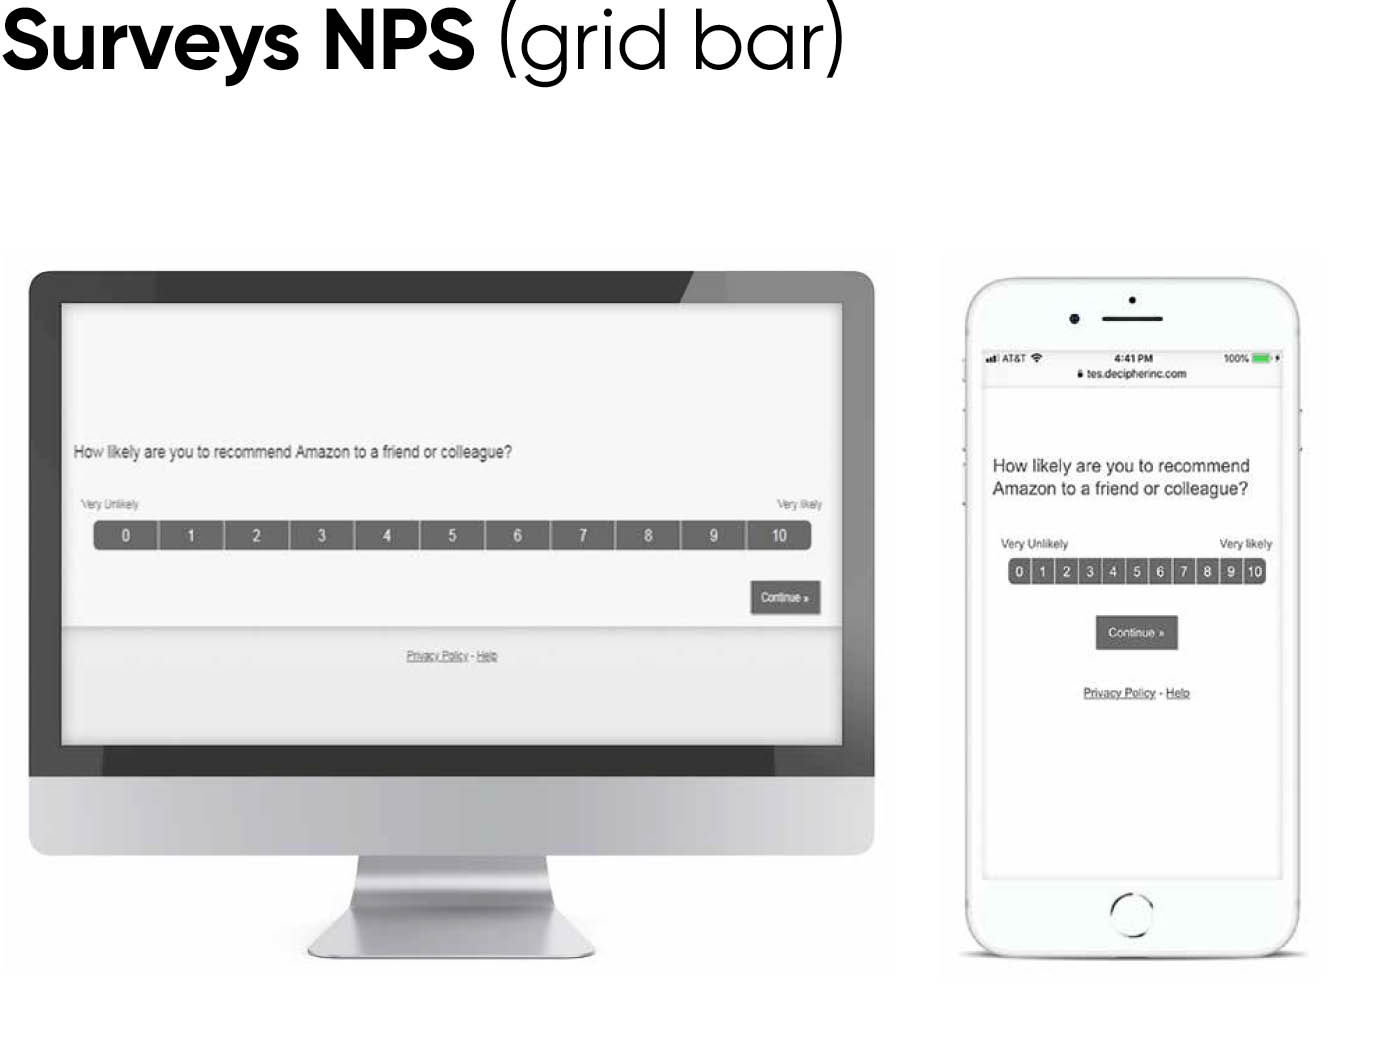
2. NPS
Net Promoter Score
(NPS) is a widely used key performance metric to monitor brand health so it’s critical that the data is accurate. This is challenging on mobile as the NP is calculated from a wide 11-point scale.
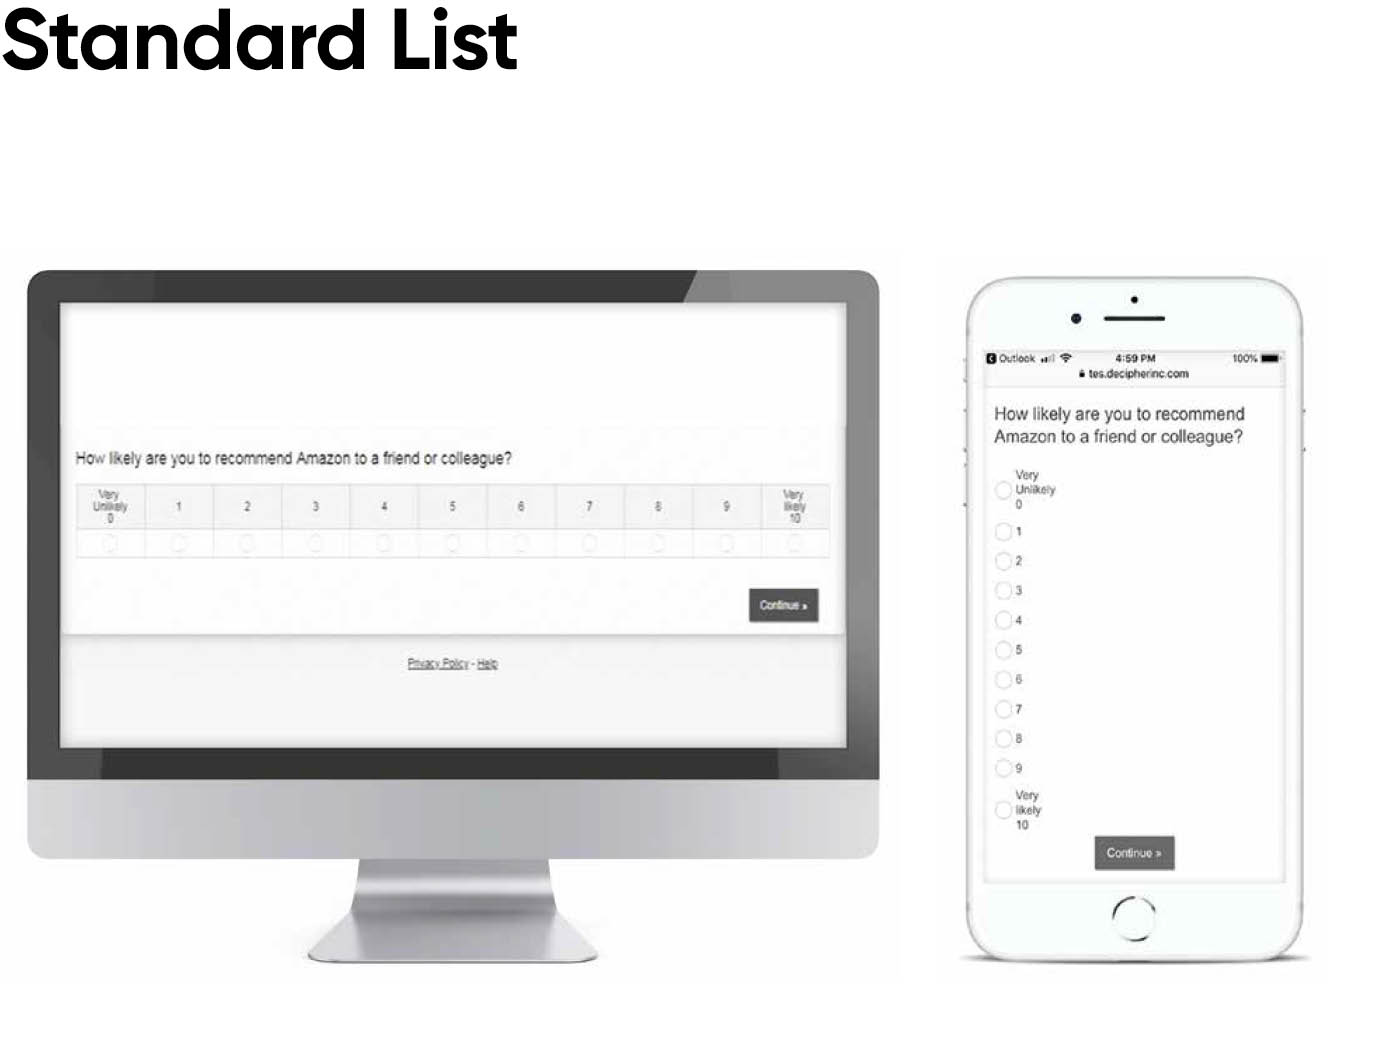
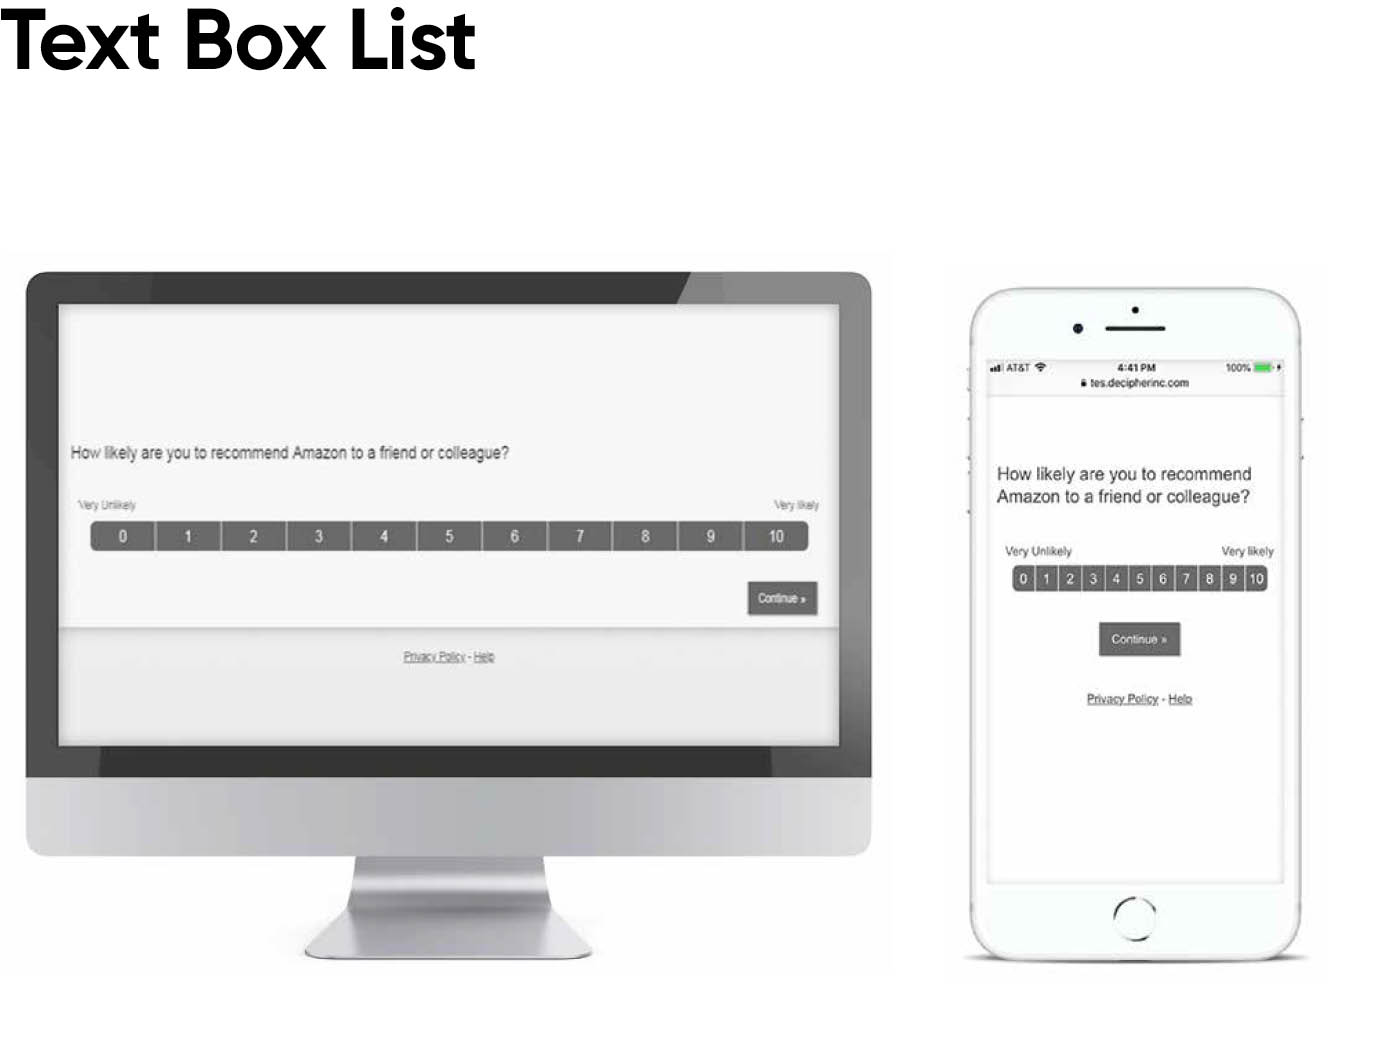
We tested two ways to display the NPS question; a standard approach using radio buttons and the FocusVision Decipher approach using a grid bar that displays consistently across desktop and mobile devices.
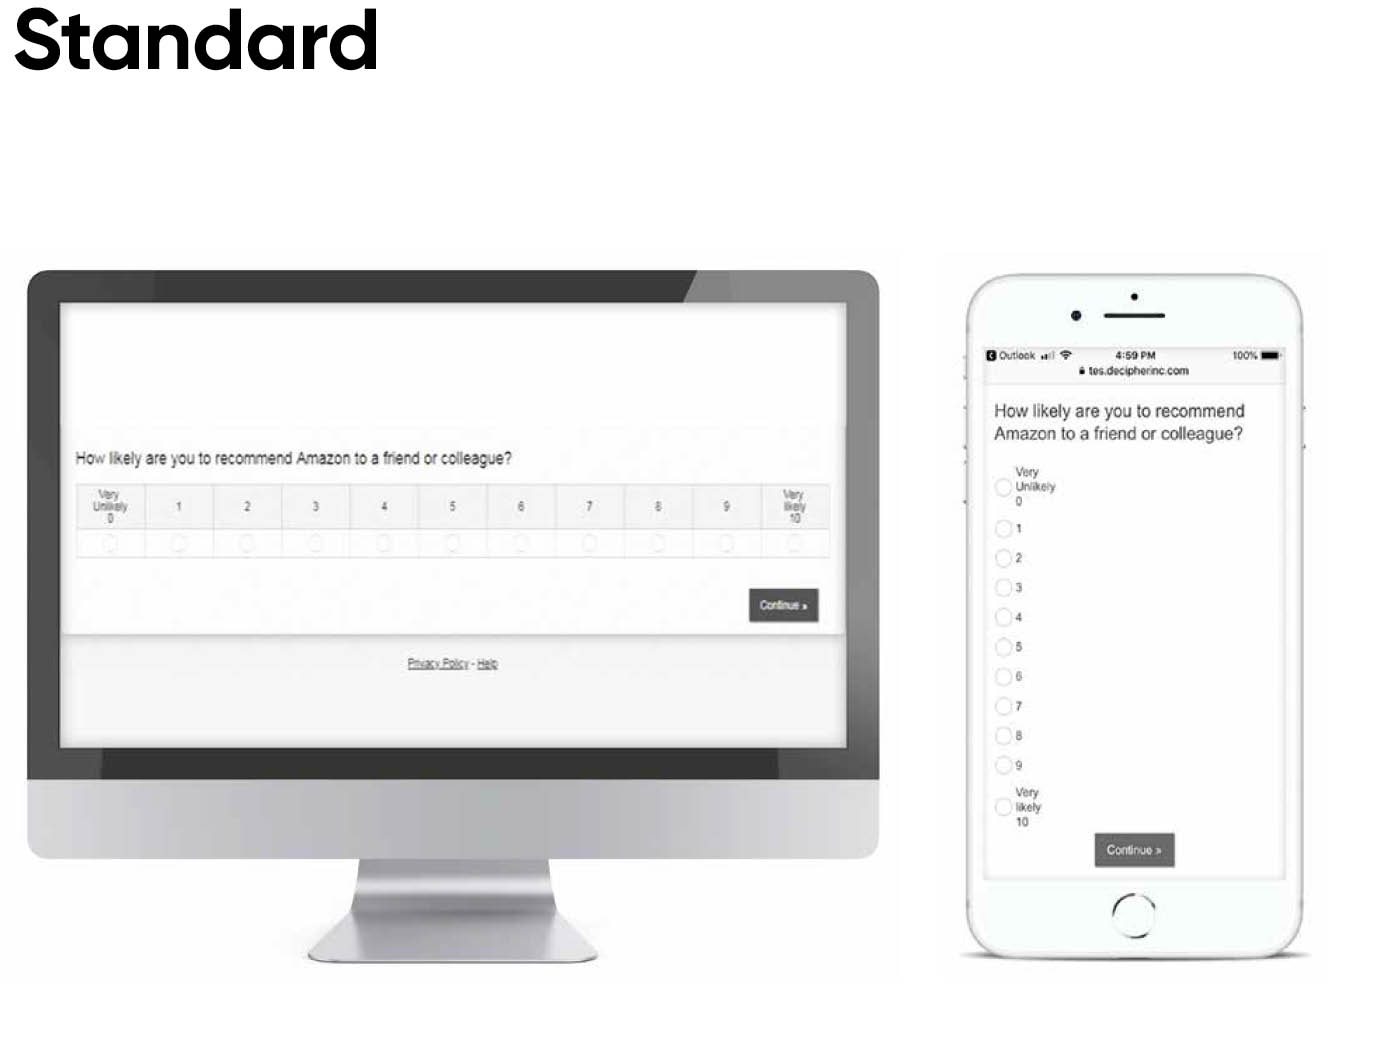
The recommended approach
- Consistent data across devices
3. List responses
Long answer option lists can have a detrimental impact on mobile survey data. The longer the list, the more likely the response provided is from the top of the list (primacy effect). This is especially challenging when randomization is not an option give the nature of the list.
We tested two ways to display the list question, a standard list displaying all items and open-ended text box lists where participants need to type in their answer(s).
The Recommended Approach
- Participants select more items in a multi-select question
- Addresses primacy effects on mobile for fact-based questions
- Participants type in new ideas / categories not considered by the researcher
Each has their strengths and draw backs, so usage depends on what is most important for the research question at hand.
Related resources
Philadelphia Insurance Companies enhances CX with Forsta-powered surveys, dashboards, and action management
Philadelphia Insurance Companies enhances CX with Forsta-powered surveys, dashboards, and action management Tools used How we helped Philadelphia Insurance Companies turn insight into real-time action—and redesign their customer experience strategy from the inside out. The challenge Scaling a growing CX program—and making every customer voice count Philadelphia Insurance Companies (PHLY) had built a strong foundation […]

A custom fit: How Forsta Visualizations adapts to Ad Hoc’s offer
A custom fit: How Forsta Visualizations adapts to Ad Hoc’s offer Tools used From concept testing to measures of employee engagement, customer experience and brand DNA measurement, Ad Hoc Research is far more than a research agency. They are recognized for their tailored research solutions to meet the specific needs of global, national, and provincial […]

Getting the balance right for KS&R
Getting the balance right for KS&R Tools used How we helped market research firm KS&R balance keeping their tailor-made approach to research with saving their people time. The challenge Creating custom-made research despite market pressures KS&R needed more than a standard survey solution. Their research required rich customization, razor-sharp methodologies, and the flexibility to reflect real-world decision-making. Off-the-shelf […]

Learn more about our industry leading platform
FORSTA NEWSLETTER
Get industry insights that matter,
delivered direct to your inbox
We collect this information to send you free content, offers, and product updates. Visit our recently updated privacy policy for details on how we protect and manage your submitted data.