Forsta Visualizations
Data in black & white.
Stories in color.
Don’t just build reports. Build momentum. Easily transform survey data into infographics and dashboards that drive action or detailed reports, including native PowerPoint. Now with market research agents.

How Visualizations brings
your data to life

Visual storytelling with impact
Bring your data to life with interactive dashboards that track trends, map journeys, and drive action. All fully customizable with code-free design.

Reports that scale and flex
Deliver tailored insights at scale with smart filters, dynamic branding, and access-controlled auto-versioning. Display your insights in their best light with help from an AI assistant, Research Agent.

AI-powered analysis in half the time
Cut manual work with AI tools built for researchers. Streamline crosstabs, weights, and stats so you find answers faster.

Designed for market researchers
Apply weights, run sig tests, flag differences, and explore open-ends. Use our intuitive tools—no plugins, no code. Just trusted tools, ready to go.
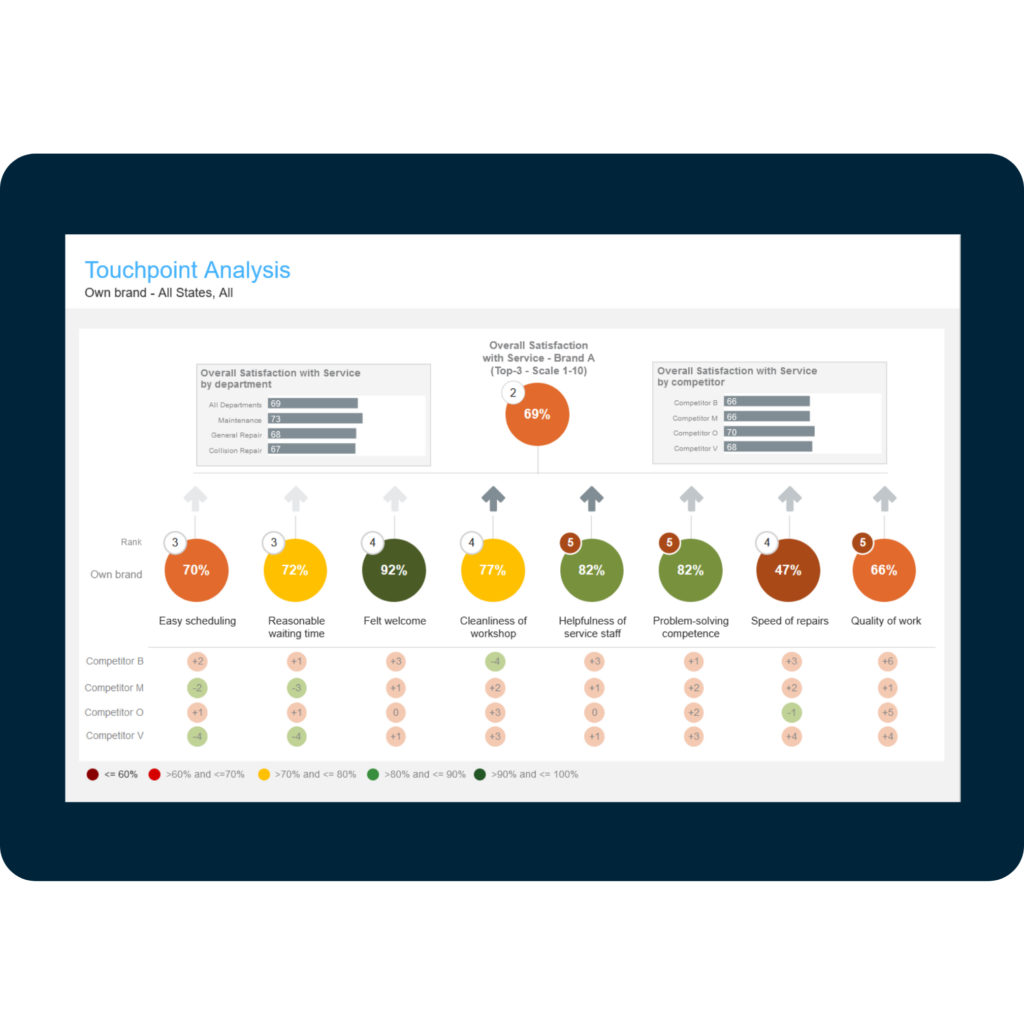
AI-powered AUTOMATION
Make magic, faster
Build infographics faster. Automate reporting. Watch data flow in live. Set rules once and see changes everywhere instantly. And with Research Agent, turn research slides into decision-ready insights in seconds.
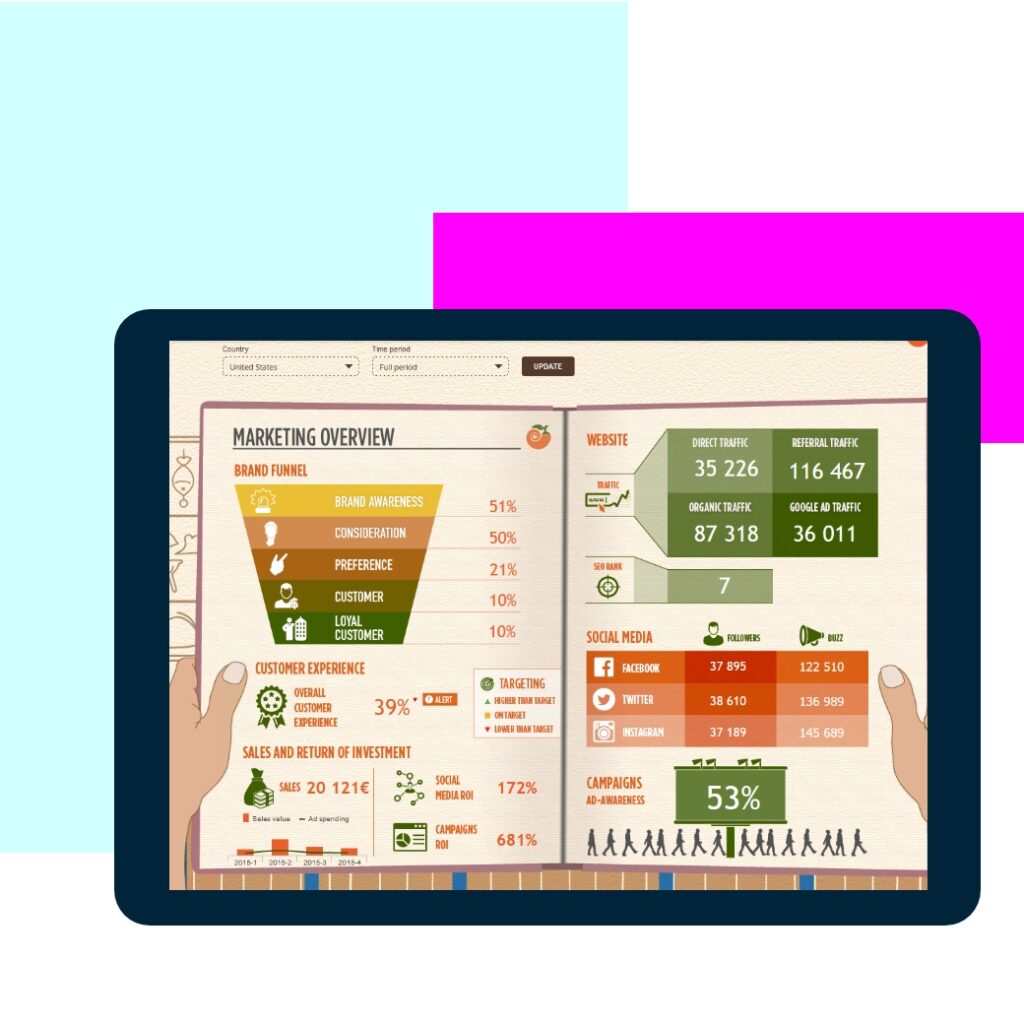
Interactive dashboards
Visual storytelling that inspires action
Create clear, compelling reports with dynamic, interactive visualizations—no coding needed. Use drag-and-drop design to explore journeys, trends, and performance in real time. Stay on brand with custom colors, fonts, and logos. Drill down directly in-report, then export to PowerPoint, Excel, PDF, and more with a single click.
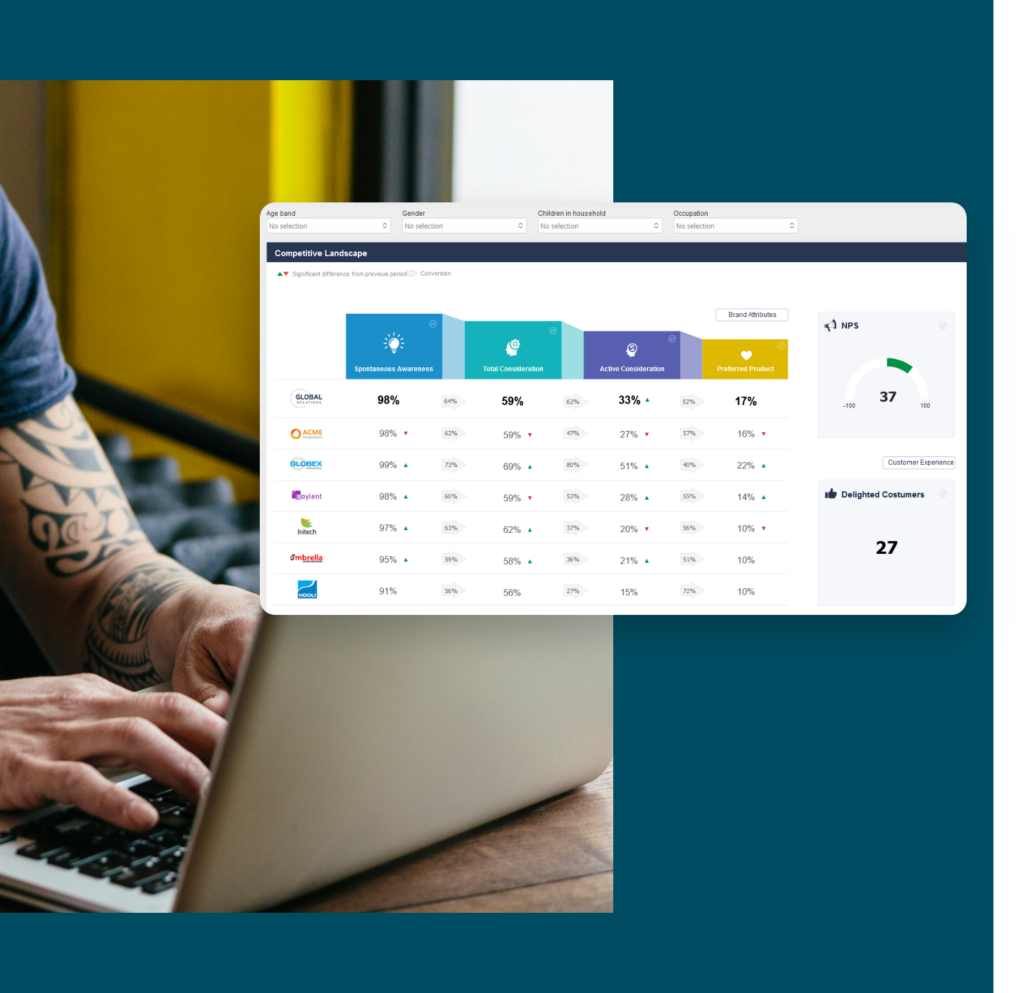
actionable reporting
One report.
Hundreds of views.
Turn a single report into hundreds of targeted, brand-aligned versions using smart filters, dynamic branding, and auto-versioning. Automate recurring reports, apply global changes instantly, and auto-generate PowerPoint decks with native charts—saving hours every cycle.
CASE STUDY
“With Visualizations it instantly became four times faster to create the initial trending report and the client was empowered to handle almost all the
Angel Roberts, VP, Trifecta Research
follow-up requests by stakeholders.”