
Creating CX dashboards that empower, engage, and drive results

In today’s digital workplace, employees are already juggling multiple platforms, logins, and dashboards—each vying for attention. If a dashboard isn’t intuitive, relevant, or clearly valuable, it becomes just another tab to ignore. And with shrinking attention spans and pressure to act fast, end users need more than just data—they need CX dashboards that are easy to understand and act on.
Well-designed dashboards are essential to moving a CX program from passive insight collection to real, measurable action. When done right, they don’t just report—they motivate. They help teams see what’s working, what’s not working and where to focus. To be truly effective, dashboards should be easy to use, action-oriented, and designed with the end user in mind. They should guide the viewer from observation to action in a clear, concise flow—removing ambiguity and delivering value at a glance.
This guide outlines seven core principles for creating CX dashboards that are impactful, intuitive, and relevant to stakeholder needs and objectives.
1) Start with clear business and user goals
It is vital that dashboards are relevant and actionable to end-users. Data should be presented in a way that is tied to corporate, team and individual objectives such as using KPI’s (key performance indicators), employees should be enabled to not only make more data-driven decisions but also enhance productivity and target actions towards improving customer experience.
Every dashboard should begin with a clear purpose. Ask:
- What outcomes are we trying to drive for the business and our customers?
- What do we want end-users to do with this information?
Knowing the purpose and outcome you want will help determine the inputs and outputs to achieve them. With this perspective, priorities will be clear, and information will be geared toward decision making vs. reporting for reporting’s sake.
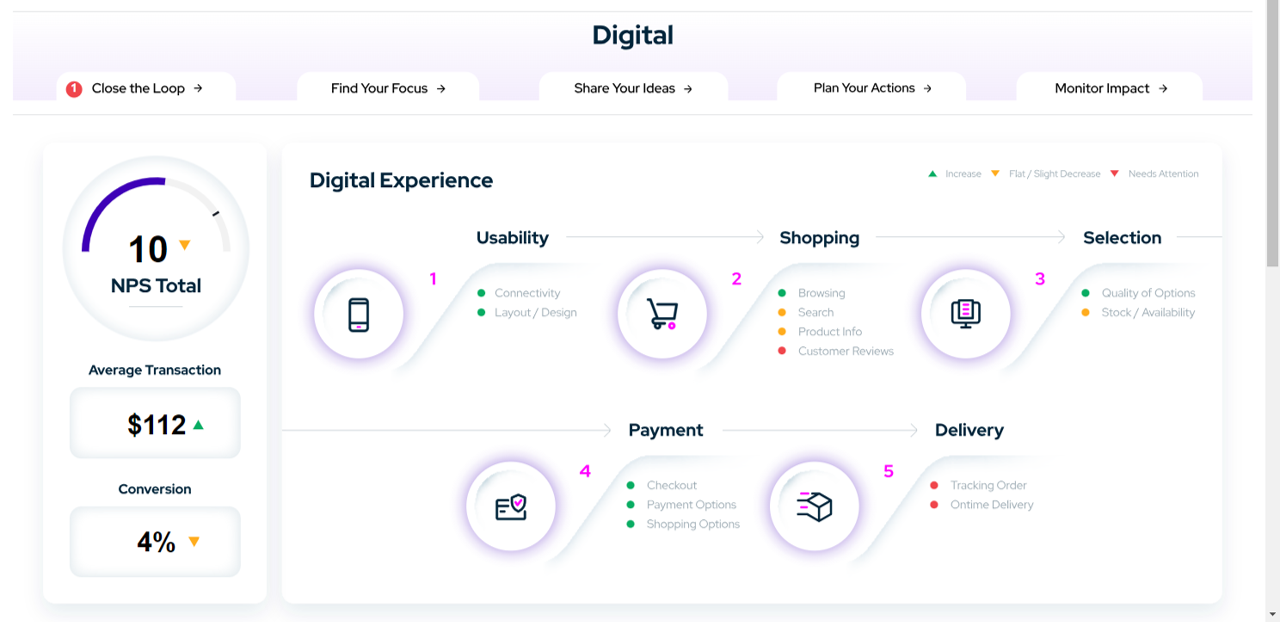
2) Align the dashboard with customer journeys
Before delving into the ideation phase of dashboard design, it is critical to understand the end-to-end customer journey framework. This is a crucial step that requires strategic thinking to identify journeys that are important for both customers and the organisation. Essentially, we want to identify which journeys will deliver the most value, which causes the most pain for your target customers, which causes pain for your organization, and which have enough complexity to warrant journey mapping.
Once we have this information, we can align the dashboard structure with the relevant customer journey(s) and interactions. This marks an evolution of your CX management practice from merely managing CX across touchpoints to effectively managing CX across journeys.
An additional benefit is that this approach enables you to connect dashboards with internal business counterparts.
Example of key journeys, and their business counterparts:
- Purchase journey and acquisition team
- Usage journey and retention team
- Help and support journey and customer service team
When each team sees the part of the journey they influence, they’re better equipped to drive improvement.
3) Choose metrics that connect journeys to outcomes
Once you’ve identified the key customer journeys, the next step is determining the metrics to populate your dashboard. A robust CX dashboard should not only report on VoC metrics but encompass these three sets of metrics:
- VoC metrics: Capturing customer sentiments and perceptions.
- Financial or business metrics: Evaluating the impact on the business’s bottom line.
- Operational metrics: Assessing the efficiency and effectiveness of internal processes.
These metrics should also be intricately linked to the specific interactions and customer journeys that have been identified and make sense in the context of your business.
For example:
| Support Journey | Buy Journey | Search Bar Interaction | |
| VOC Metrics | CSAT (Customer Satisfaction) or CES (Customer Effort Score) | Website CSAT, Website Accomplishment | % Yes Meet Needs |
| Financial / Business Metrics | Cost per ticket, Customer Retention Cost | Conversion Rate, Basket Value, Average Order Value | Conversation Rate for Search Users, Average Order Value Increase |
| Operational Metrics | FCR (First Contact Resolution), Ticket Volume, Time to Close | Average Page Load Time, Checkout Error Messages, Order Fulfilment Times | Search Load Speed, % No Results, Number Clicks |
To select the metrics most appropriate for your dashboard, ask yourself those two questions:
- Which one of the identified metrics represents the best, the goal the customer is trying to achieve?
- What is your corresponding business goal? What’s the most appropriate metric to measure it?
By aligning metrics with specific journeys, your CX dashboards become a powerful tool for understanding, managing, and optimizing the customer experience
4) Get stakeholder buy-in
Ultimately, CX is an organizational effort, not confined to a single team or person. It is necessary to understand key stakeholder requirements for CX dashboards to ensure that the dashboard operates in a way which provides value to end-users.
Engage stakeholders in each relevant department and facilitate workshops to design these dashboards. Additionally, early involvement with stakeholders will encourage them to take ownership and accountability for ensuring CX success, therefore increasing cultural adoption of becoming a truly customer centric organization.
It is important for a central governance team to maintain oversight and control over dashboard design to ensure that companywide frameworks are being adhered to and that the dashboards will make sense within the larger CX program.
5) Create role-based dashboards
Many organizations with comprehensive CX programs find they are trying to provide value to several business areas. Within those business areas, there will be a variety of stakeholders with different roles, responsibilities and objectives when accessing results through dashboards. Therefore, not only should CX dashboards be aligned with the customer journey, but they should also align with the roles of the end-users. Role-based dashboards provide information that is specifically relevant to the responsibilities and priorities of each role.
For example:
- A customer service manager might track FCR, satisfaction, and ticket volume.
- A product manager might focus on feature usage, NPS, and verbatim feedback.
- A regional leader may want an at-a-glance view of their location’s performance trends.
Ensure that each dashboard provides enough information for end-users to explore the data to understand pain-points, root causes and impact.
Role-based CX dashboards ensure that the most pertinent data is shown which enables faster and more informed decision-making, as users are not overwhelmed with extraneous information.
Users save time as they do not need to sift through irrelevant data to find the insights they need. This allows them to focus more on their core tasks and responsibilities.
An additional benefit is that employees feel more empowered when they have access to data that directly impacts their role. Role-based dashboards can also highlight individual and team achievements, fostering a culture of recognition and appreciation. When employees can see the direct impact of their actions on the customer experience, it builds a stronger sense of ownership and purpose in their daily work.
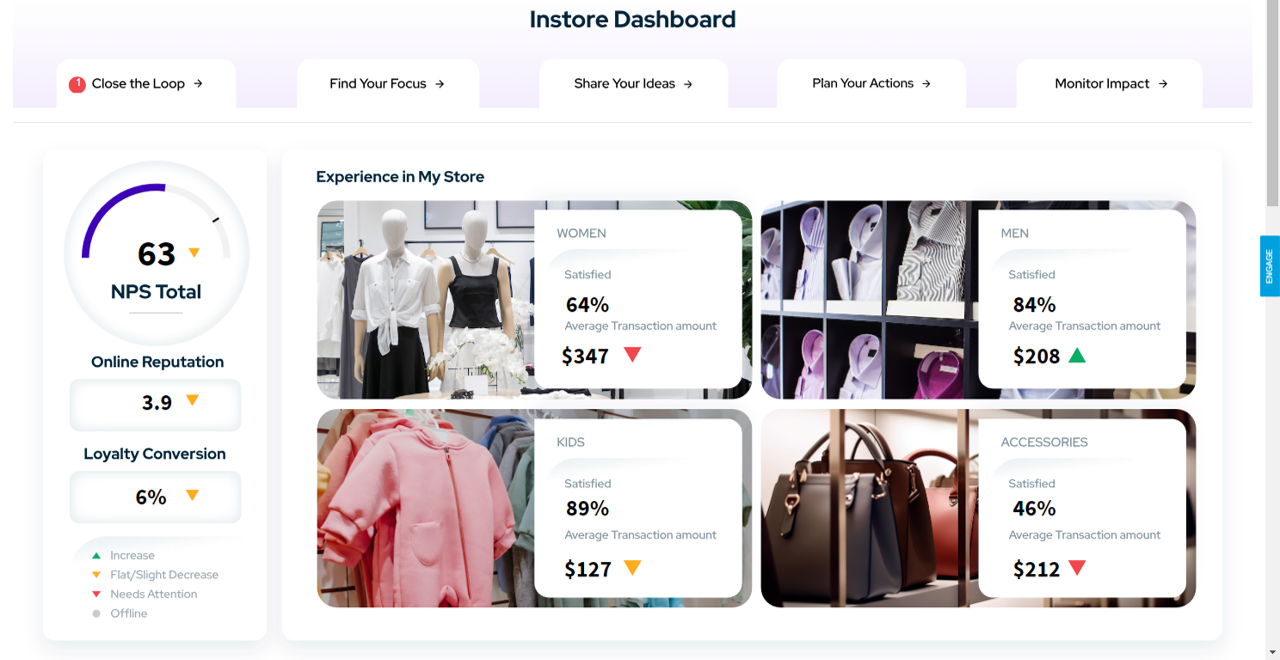
6) Design for usability and storytelling
Each dashboard should tell a story that end-users can act on to improve the customer experience. Therefore, dashboard functionality and how data is displayed is very important. Make sure the content you include is easy to read and understand. Keep the dashboard design simple, overcomplicating it will impede your ability to identify and act on insights.
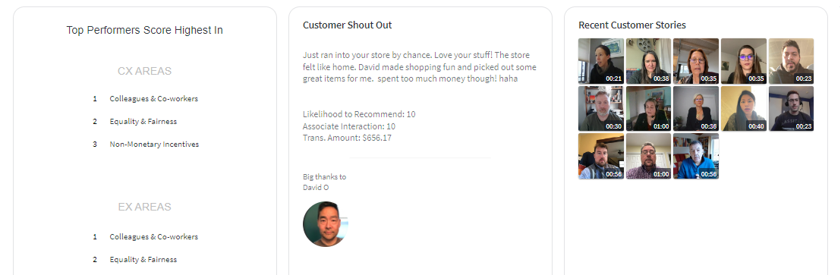
Make sure your CX dashboards include room for customer stories. These can be simple, like customer quotes that show real emotion. Or they can be more complex, like sharing a video of a customer telling their story.
Connecting with the real emotion of human stories will do more to get leaders and others to appreciate the importance of the customer experience. Stories and emotions help foster a sense of understanding and connection with the customer, therefore inciting empathy with stakeholders and drive action.
Here are some practical guidelines for dashboard design:
- Prioritize simplicity so content is easy to read and understand.
- Keep font choices and colors to a minimum.
- Keep design choices consistent across dashboards.
- Enable features for employees to quickly share or download data.
- Offer historical and current view of business data to enable employees to quickly identify trends.
- Offer filtering options that are meaningful to the end-user and are directly connected to business goals (e.g. filter for persona types).
- Add instructions and information on the dashboard itself, to ensure end-users know how to use the dashboard and what information they can extract. This helps to future proof the dashboard in case new stakeholders come on board.
- Use technology to pre-package insights in a meaningful way (e.g. Text Analytics, AI Summary widgets).
7) Review and improve
Dashboards require ongoing evaluation and refinement rather than a one-time setup. Maintaining close engagement with stakeholders is essential to ensure they continue to meet evolving business needs. A structured approach could involve regular review meetings scheduled every 6 to 12 months, depending on the pace of business changes.
For a more agile feedback loop, consider embedding lightweight surveys directly within the dashboard. Prompt users with questions like, “What would make this dashboard more helpful?” or “What additional views or metrics would you find valuable?” This real-time input enables continuous refinement, keeping dashboards user-focused and high-impact.
It’s also important to stay on top of new dashboard product features. At Forsta, account teams discuss CX dashboards as part of their regular QBR’s with clients ensuring that clients get the most out of our latest innovations.
Ready to build CX dashboards that drive results?
A dashboard is more than a reporting tool; it’s a lever for transformation. When built with purpose, designed with users in mind, and aligned to key journeys and outcomes, it becomes a catalyst for better decisions, stronger accountability, and a more customer-centered culture.
Ready to turn your CX dashboards into drivers of action?
At Forsta, we help organizations transform their dashboards into intuitive, insight-led experiences that empower teams and accelerate change. Whether you’re just starting to build or looking to enhance what you already have, our HX Platform and expert services can help you design CX dashboards that not only inform but inspire. Talk to us about your dashboard strategy today.
Related stories
St. Luke’s Medical Center adopts Forsta’s HX Platform to elevate human experience across the care journey
St. Luke’s Medical Center adopts Forsta’s HX Platform to elevate human experience across the care journey [MANILA, PHILLIPINES, FEB. 26, 2026] – St. Luke’s Medical Center, one of Asia-Pacific’s most trusted and innovative healthcare institutions, has selected the HX Platform, from Forsta, a Press Ganey company, to transform how the organization listens, understands, and acts on the voice of patients, families, and healthcare workers. The adoption […]

Agentic AI: Your personal research assistant
Agentic AI: Your personal research assistant Agentic AI: Your personal research assistant Three years on since the launch of consumer-facing Large Language Models (LLMs), and the AI conversation has travelled from amazement to business function. The initial launch was thrilling; the future is still tantalizingly close with new developments every month, and nowhere is the […]

Storage King chooses Forsta to drive ROI through a holistic customer journey view
Storage King chooses Forsta to drive ROI through a holistic customer journey view Storage King leverages the HX platform’s AI capabilities to consolidate customer feedback and drive positive change across 200+ locations [SYDNEY, AUSTRALIA, FEB. 19, 2026] – Forsta, a Press Ganey company, today announced that Storage King, one of Australia and New Zealand’s leading self‑storage providers, has selected the Human Experience (HX) Platform to power the next stage of its customer […]

Learn more about our industry leading platform
FORSTA NEWSLETTER
Get industry insights that matter,
delivered direct to your inbox
We collect this information to send you free content, offers, and product updates. Visit our recently updated privacy policy for details on how we protect and manage your submitted data.