Storytelling
From black and white, to stories in color

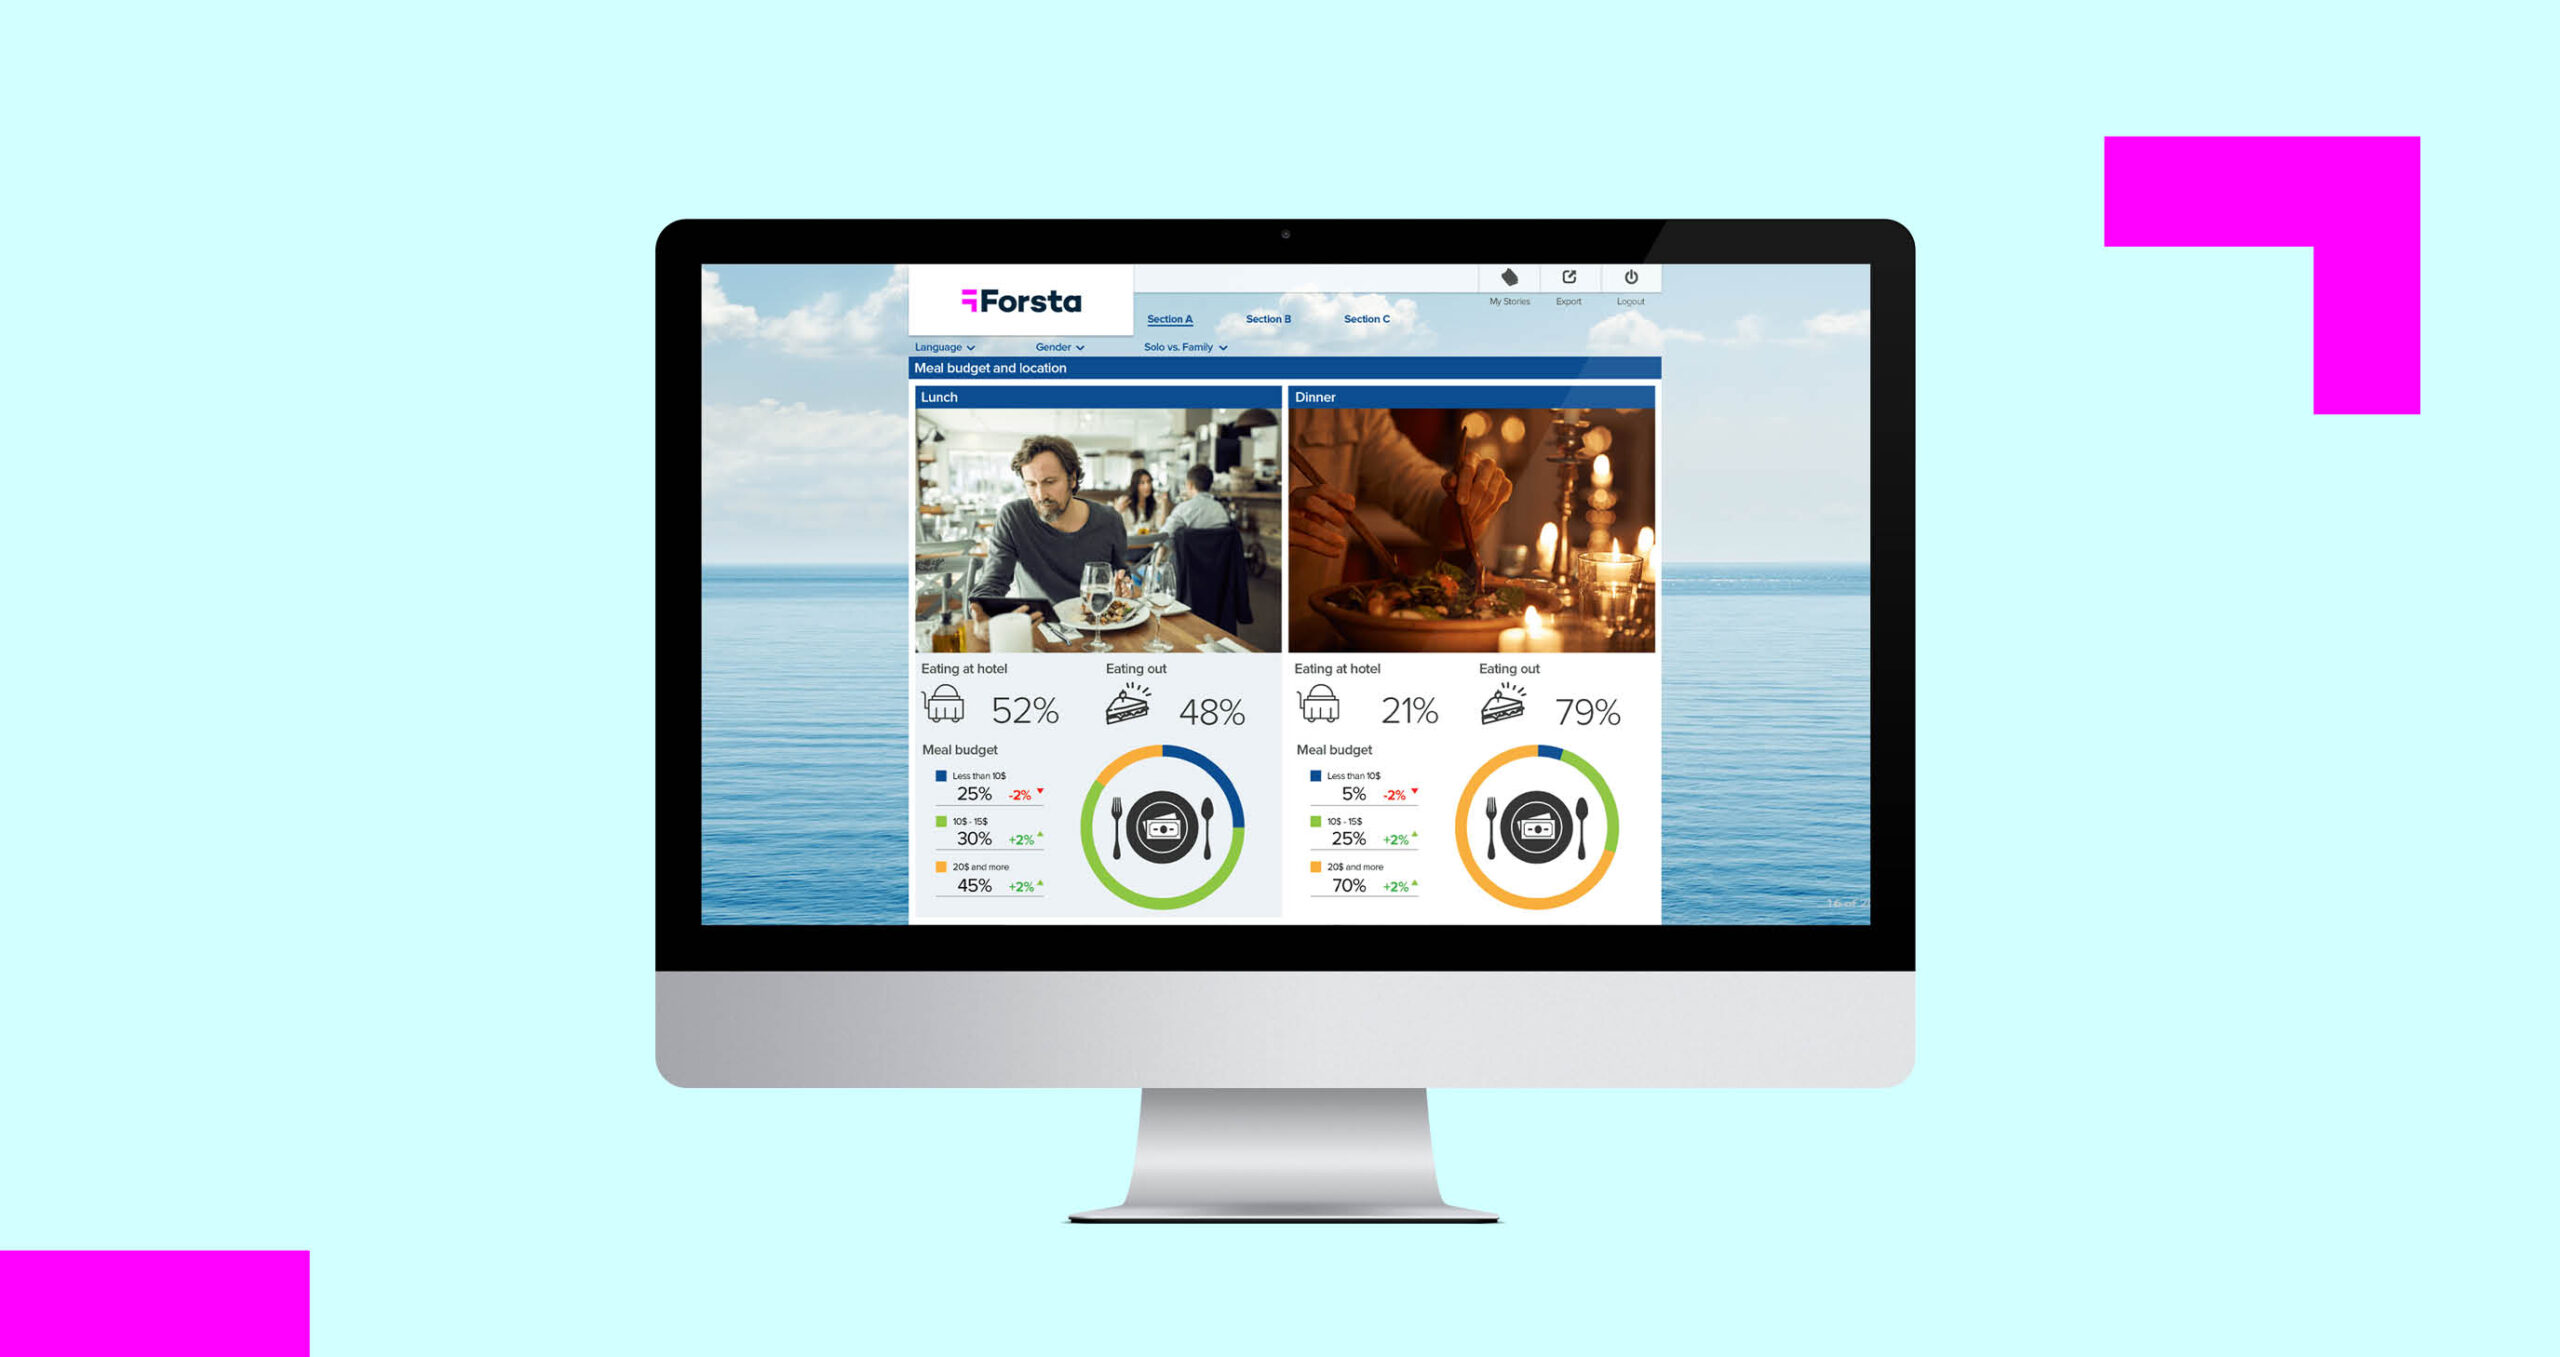
Make your data mean something and craft infographics that can explain, inspire and convince people to act. Show the steps in a customer journey, shine a light on issues and reveal trends in your data that truly come to life.
Transform your data
It’s easy to build slick infographics. A drag-and-drop workspace and smart design tools help you visualize ideas quickly. You can create from scratch, or save as templates and adapt. You can then use these alone or build them into PowerPoints, PDFs and online dashboards.
Let the data come to you
Wherever your data lives, be it in a survey system, CRM or social platform; our APIs enable it to flow live and direct into your infographics. And if anything doesn’t look right, alerts will let you know if something is incorrect.
Cut the clicks
Set up rule changes so as the data flows in, it instantly updates your infographics. No more tedious, manual updates of charts or correcting errors.
Key features
Intuitive PowerPoint building
The intuitive drag and drop interface makes its easy to build PowerPoints and update them throughout. Export your PowerPoints into other common file types.
Smarter updates
With global controls and smart logic, global text changes, color management and much more can be changed once, and replicated throughout an entire report.
Stay alert and
stay in time
Base size warnings
can hide data or
alert the user plus
additional variables,
functionalities and
features can be
customized for each
report user.